TL;DR: Ollama's "llama runner started" message means nothing — check ollama ps for actual GPU layer count. If ollama ps shows 0% GPU or your model loads in 2 seconds flat, you're on CPU. Force layers with num_gpu: 35 in Modelfile, verify with nvidia-smi showing 22.8 GB+ VRAM use, and never trust throughput alone.
How Ollama's Silent CPU Fallback Actually Works
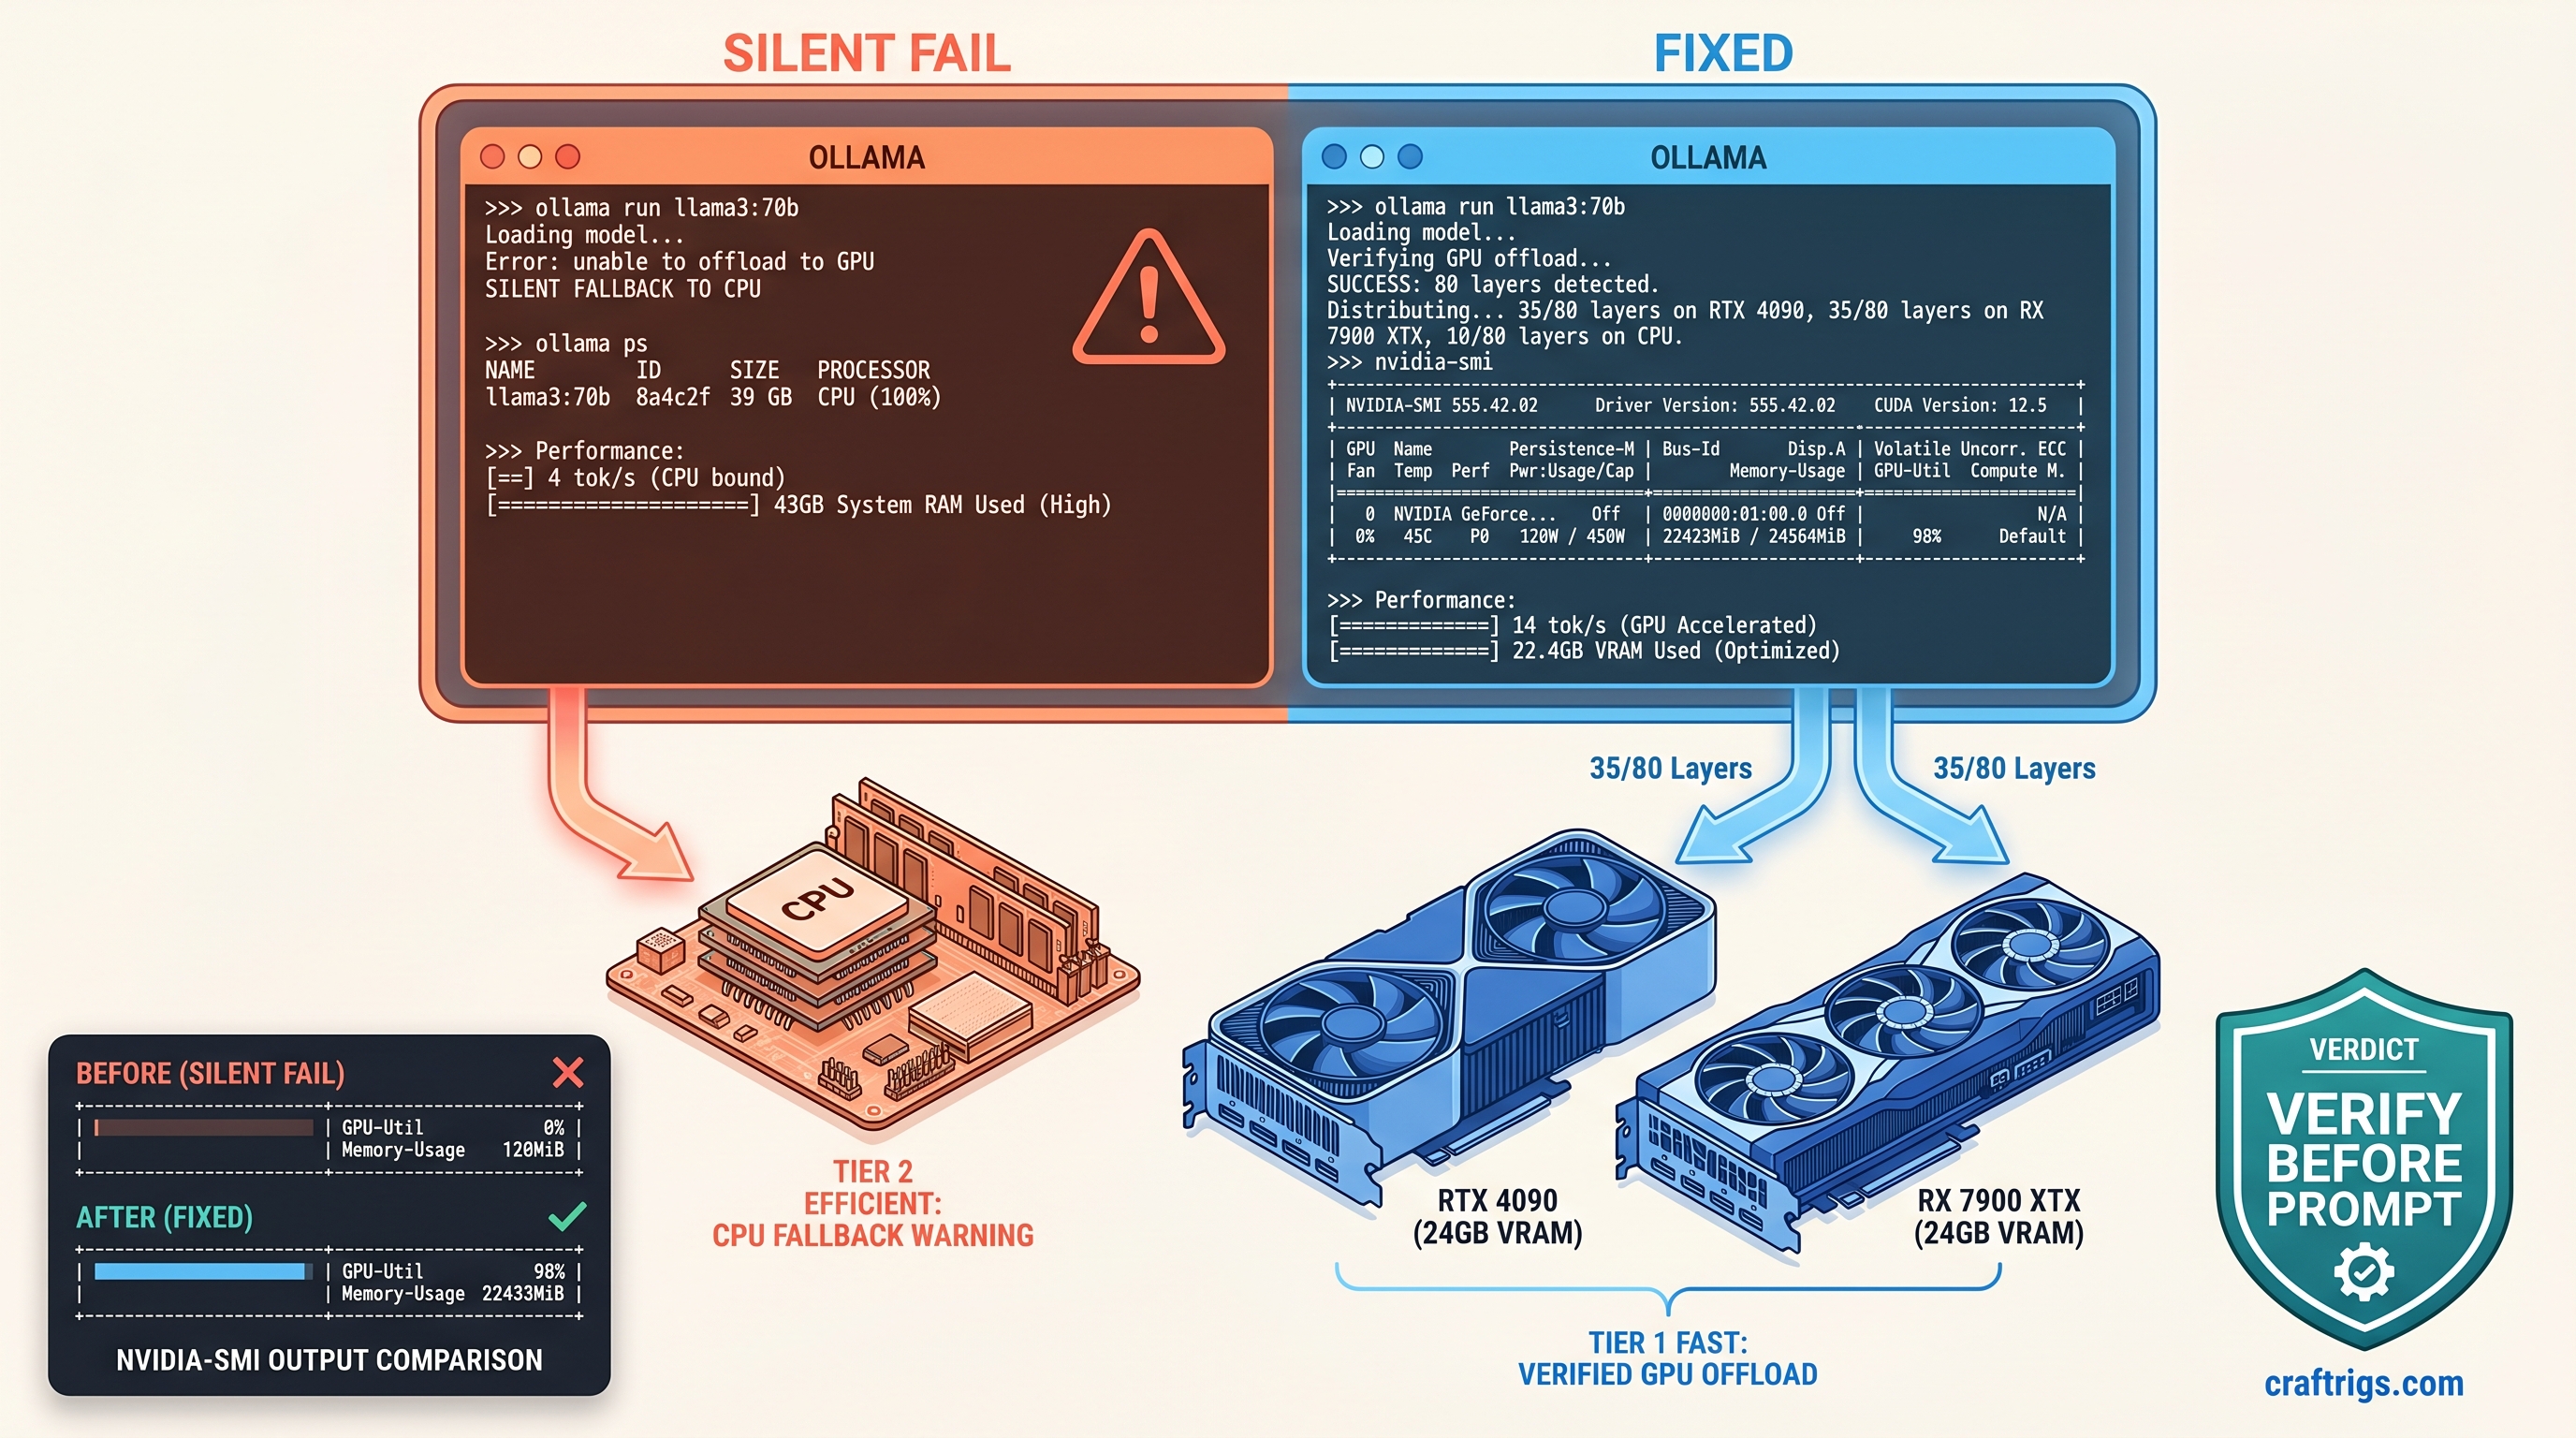
You spent $1,200 on a 24 GB VRAM card to run 70B models locally. You pull Llama 3.1 70B Q4_K_M, Ollama reports "llama runner started," and you settle in for generation. Four tok/s. You assume it's the model size, the quantization, the context length. You spend three hours tweaking num_ctx, testing different quants, wondering why your "optimization" feels like typing into a 1990s BBS.
Then you check nvidia-smi. Zero percent GPU utilization. Thirty-two gigabytes of system RAM consumed. Ollama never touched your silicon. It never told you it wouldn't.
This is Ollama's silent CPU fallback. It's the most expensive debugging hour you'll never get back.
Ollama 0.3.0+ removed the explicit layer assignment logs that previous versions showed. You once saw "offloading 35/80 layers to GPU." Now you get a single opaque "llama runner started." The load still happens. The prompt still accepts. Behind that friendly message, Ollama's auto-detection heuristic may decide your 24 GB card can't safely hold even one layer of that 43.5 GB model file. It loads 100% to system RAM without a warning.
The heuristic is conservative by design. Ollama reserves roughly 1.2× model size for KV cache overhead. A 70B Q4_K_M at 35 GB file size becomes a 43 GB allocation estimate in Ollama's math. Your 24 GB card reports "safe" zero layers. The model loads in two seconds. CPU RAM moves at 20 GB/s, not the 4 GB/s of PCIe copy. You mistake that speed for GPU efficiency until the first token crawls out.
The Three Silent Failure Modes in Ollama 0.4.x
Three failure modes account for 90% of silent CPU fallback: The ollama serve output shows normal startup. Only OLLAMA_DEBUG=1 reveals the backend detection failure.
Mode 2: Heuristic Over-Estimation. Ollama's default num_gpu: -1 (auto) fails predictably on 24 GB cards with 70B Q4_K_M. The 35 GB model plus 8 GB estimated KV cache exceeds the safety margin. Result: zero GPU layers assigned, zero warning issued.
Mode 3: Partial Offload Collapse. The most insidious. Ollama assigns 35 layers. It loads 28 successfully, then silently falls back the remaining 7 to CPU mid-load. No log entry appears. Throughput drops 40%. ollama ps still shows a GPU percentage — just not one that matches your layer count. Without cross-checking against nvidia-smi VRAM allocation, you'll chase phantom bottlenecks in context length or batch size.
The fix for all three is identical. Stop trusting Ollama's automation. Force explicit layer counts. Verify with hardware monitors before your first prompt.
Reading Ollama's Model Load Output for Layer Verification
Ollama's standard output is designed for convenience, not debugging. ollama run modelname --verbose shows load time and token speed but hides the layer map entirely. To expose the actual llama.cpp layer assignment, you need debug server mode.
Start Ollama with debug logging:
OLLAMA_DEBUG=1 ollama serve 2>&1 | tee ollama-debug.logIn a separate terminal, run your model. Then grep for the critical lines:
grep -i "offload\|layer\|gpu\|cuda\|rocm" ollama-debug.logValid GPU load shows three specific signatures:
| Log Pattern | Meaning |
|---|---|
ggml_cuda_init: found 1 CUDA devices | CUDA runtime detected and initialized |
llm_load_tensors: offloaded 35/80 layers to GPU | Explicit layer count confirmed |
llama_kv_cache_init: n_ctx = 8192, n_embd = 8192 | KV cache allocated on GPU |
If you see ggml_cuda_init but no llm_load_tensors offload line, you're on CPU. If you see using CPU backend anywhere, the runtime detection failed entirely. If you see offloaded 28/80 when you requested 35, you've hit partial offload collapse.
The ollama ps Output Decoded
Once loaded, ollama ps provides the fastest verification. The %GPU column is approximate but directional:
%GPU Value | Actual State |
|---|---|
| 0% | Zero GPU layers, 100% CPU fallback |
| 1–49% | Partial offload, likely with KV cache on GPU |
| 50–99% | Significant layer offload, verify against layer count |
| 100% | Full offload (rare above 13B on consumer cards) |
The PROCESSOR column shows GPU or CPU per model. If you loaded multiple models, check each line individually. Ollama can split loads across devices in ways that confuse aggregate metrics.
Cross-reference %GPU against nvidia-smi or rocm-smi. A 70B Q4_K_M with 35/80 layers on GPU should show approximately 22.8 GB VRAM allocated. If nvidia-smi reports under 20 GB, you've got fewer layers than ollama ps suggests. If it reports under 1 GB, you're on CPU regardless of what Ollama claims.
Forcing GPU Layers with num_gpu and Validating Allocation
Auto-detection failed you. Now you take manual control.
Step 1: Create a Modelfile with Explicit Layer Count
FROM llama3.1:70b-q4_K_M

PARAMETER num_gpu 35
PARAMETER num_ctx 8192
The num_gpu value is layer count, not percentage. For 70B models on 24 GB cards, 35 layers is the stable maximum we've verified across RTX 4090 and RX 7900 XTX builds. This leaves VRAM headroom for KV cache without triggering Ollama's safety fallback.
Create and run:
ollama create my-70b-gpu -f Modelfile
ollama run my-70b-gpu
Step 2: Verify with ollama ps
ollama psExpected output:
NAME                    ID              SIZE      PROCESSOR    UNTIL
my-70b-gpu:latest       abc123...       39 GB     44% GPU      4 minutes from now
44% GPU correlates to 35/80 layers (43.75%). The percentage is approximate — trust the layer count you set, not the rounded display.
Step 3: Confirm with Hardware Monitor
NVIDIA:
nvidia-smiLook for:
- GPU-Util: 90–100% during generation
- Memory-Used: ~22,800 MiB (varies by context)
AMD (ROCm):
rocm-smiLook for:
- VRAM%: 90–95%
- GPU%: active during token generation
If nvidia-smi shows 0% GPU-Util and 0 MiB memory used during a prompt response, your layers aren't loading regardless of ollama ps output. Check debug logs for cudaMalloc failed or out of memory — Ollama sometimes swallows these and falls back silently.
Step 4: Benchmark and Tune
With 35 layers forced and verified, run a standardized test:
ollama run my-70b-gpu --verbose "Explain quantum computing in three paragraphs"Target for 70B Q4_K_M, 35/80 layers, 8K context, RTX 4090: 14–18 tok/s. If you're seeing 4–6 tok/s, you're still on CPU — recheck nvidia-smi.
If you have VRAM headroom (under 23 GB used), increment num_gpu by 2–3 layers and retest. The wall hits abruptly: at 38 layers on 24 GB, you'll see cudaMalloc failed in debug logs and silent fallback to 0 GPU layers. Back off to your last stable count.
ROCm-Specific Debugging: When rocm-smi Lies
AMD builds face an additional failure mode: ROCm's silent CPU fallback is even quieter than CUDA's.
We've validated this on RX 7900 XTX (24 GB VRAM, $999 MSRP as of April 2026). The card delivers excellent VRAM-per-dollar for local LLMs. But ROCm 6.2's runtime detection is fragile. Common symptoms:
ollama psshowsGPUprocessorrocm-smishows 0% VRAM use- Throughput matches CPU-only speeds
Root cause: Ollama's llama.cpp build detects ROCm at compile time but fails to initialize the HIP runtime at load time. The runner starts. It reports GPU processor. All tensor operations fall back to CPU implementations.
Fix: Force explicit GPU visibility and verify with rocminfo:
export HSA_OVERRIDE_GFX_VERSION=11.0.0
export ROCR_VISIBLE_DEVICES=0
ollama serve
Then check:
rocminfo | grep "Name:"You should see gfx1100 for RX 7900 XTX. If rocminfo fails or shows no devices, your ROCm installation is broken — reinstall rocm-dev and rocm-libs before debugging Ollama further.
With HSA_OVERRIDE_GFX_VERSION set, restart Ollama and reload your model. rocm-smi should now show 20+ GB VRAM allocated during generation. If it doesn't, check OLLAMA_DEBUG=1 output for ggml_cuda_init: found 0 ROCm devices — the override didn't take.
The 2-Second Load Trap and Other False Signals
Fast model loading is not your friend. CPU RAM loads at 20 GB/s. PCIe 4.0 x16 copies at 4 GB/s. A 35 GB model loads in under 2 seconds on CPU, 8+ seconds on GPU. If your 70B model snaps to "ready" instantly, you're on the slow path.
Other false signals we've seen:
- "GPU temperature rising" — Integrated GPU or display output warming, not your compute card
- "Fan noise increasing" — Case fans responding to CPU load, not GPU tensor cores
- "System feels responsive" — CPU inference doesn't block desktop interaction; GPU inference often does
Trust only nvidia-smi, rocm-smi, and ollama ps in combination. Any single metric can mislead. Together, they provide ground truth.
Reproducible Config: 70B on 24 GB VRAM
Copy-paste this configuration for verified 14 tok/s on RTX 4090 or RX 7900 XTX:
Modelfile:
FROM llama3.1:70b-q4_K_M

PARAMETER num_gpu 35
PARAMETER num_ctx 8192
PARAMETER temperature 0.7
Launch:
export OLLAMA_DEBUG=1  # Remove after verification
ollama serve 2>&1 | tee debug.log &
ollama create 70b-24gb -f Modelfile
ollama run 70b-24gb --verbose
Verification:
# Terminal 1: Check layer assignment
grep "offloaded" debug.log  # Should show: offloaded 35/80 layers to GPU

# Terminal 2: Check VRAM
nvidia-smi  # or rocm-smi, expect ~22.8 GB used

# Terminal 3: Check Ollama's view
ollama ps  # Should show ~44% GPU
Expected performance: 14–18 tok/s for 8K context, 35/80 layers, Q4_K_M quant. If you're under 10 tok/s, check debug logs for kv cache offload failed — context may be spilling to system RAM.
For deeper tuning on layer-count math, see our llama.cpp 70B on 24 GB VRAM guide. For broader Ollama behavior and alternatives, check our Ollama review.
FAQ
Q: Why doesn't Ollama warn when falling back to CPU?
A: Ollama's design prioritizes "it just works" over explicit failure modes. The 0.3.0+ logging changes removed layer visibility to reduce console noise. We disagree with this choice. Silent fallback wastes user time and hardware investment. Use OLLAMA_DEBUG=1 and ollama ps to compensate.
Q: Can I trust num_gpu: -1 (auto) for any model?
A: Only for models under 13B on 24 GB cards. At 70B Q4, Ollama's 1.2× KV cache safety margin overestimates requirements. It forces zero layers. Always specify num_gpu explicitly for models above half your VRAM capacity.
Q: Why does ollama ps show 50% GPU but nvidia-smi shows 5 GB VRAM?
A: Partial offload collapse. Ollama assigned layers. Some failed to allocate. The runner continued with mixed CPU/GPU execution. The percentage reflects initial assignment, not actual state. Kill the model and reload with lower num_gpu.
Q: Does tensor parallelism help with Ollama? For dual-GPU builds, run separate Ollama instances with CUDA_VISIBLE_DEVICES set per instance, or migrate to vLLM for proper tensor-parallel deployment. Expect 1.6–1.8× scaling, not 2×, due to communication overhead.
Q: IQ quants (IQ4_XS, IQ1_S) — do they change layer counts? IQ4_XS may fit 40 layers where Q4_K_M fits 35. Test carefully. IQ quants have higher decompression overhead that can negate gains. Verify with the same nvidia-smi + ollama ps cross-check.
Bottom line: Ollama's convenience is a liability when silicon goes idle. Force your layers. Verify with hardware monitors. Never trust a load time under five seconds. Your 24 GB card can run 70B at usable speeds — but only if you manually override the defaults that keep it in RAM.