TL;DR: Ollama pre-allocates KV cache for your full NUM_CTX on model load. An 8192 context on Llama-3.1-70B-Q4 eats 6.1 GB VRAM before first token. Set NUM_CTX to your actual max prompt+completion, not the model's theoretical limit. Use the formula: KV cache GB = 2 × num_layers × num_heads × head_dim × context_length × 2 bytes / 1e9. Verify with watch -n 0.5 rocm-smi during ollama run — if allocation jumps to within 500 MB of your VRAM, NUM_CTX is too high.
The Silent Killer: How Ollama's KV Cache Pre-Allocation Works
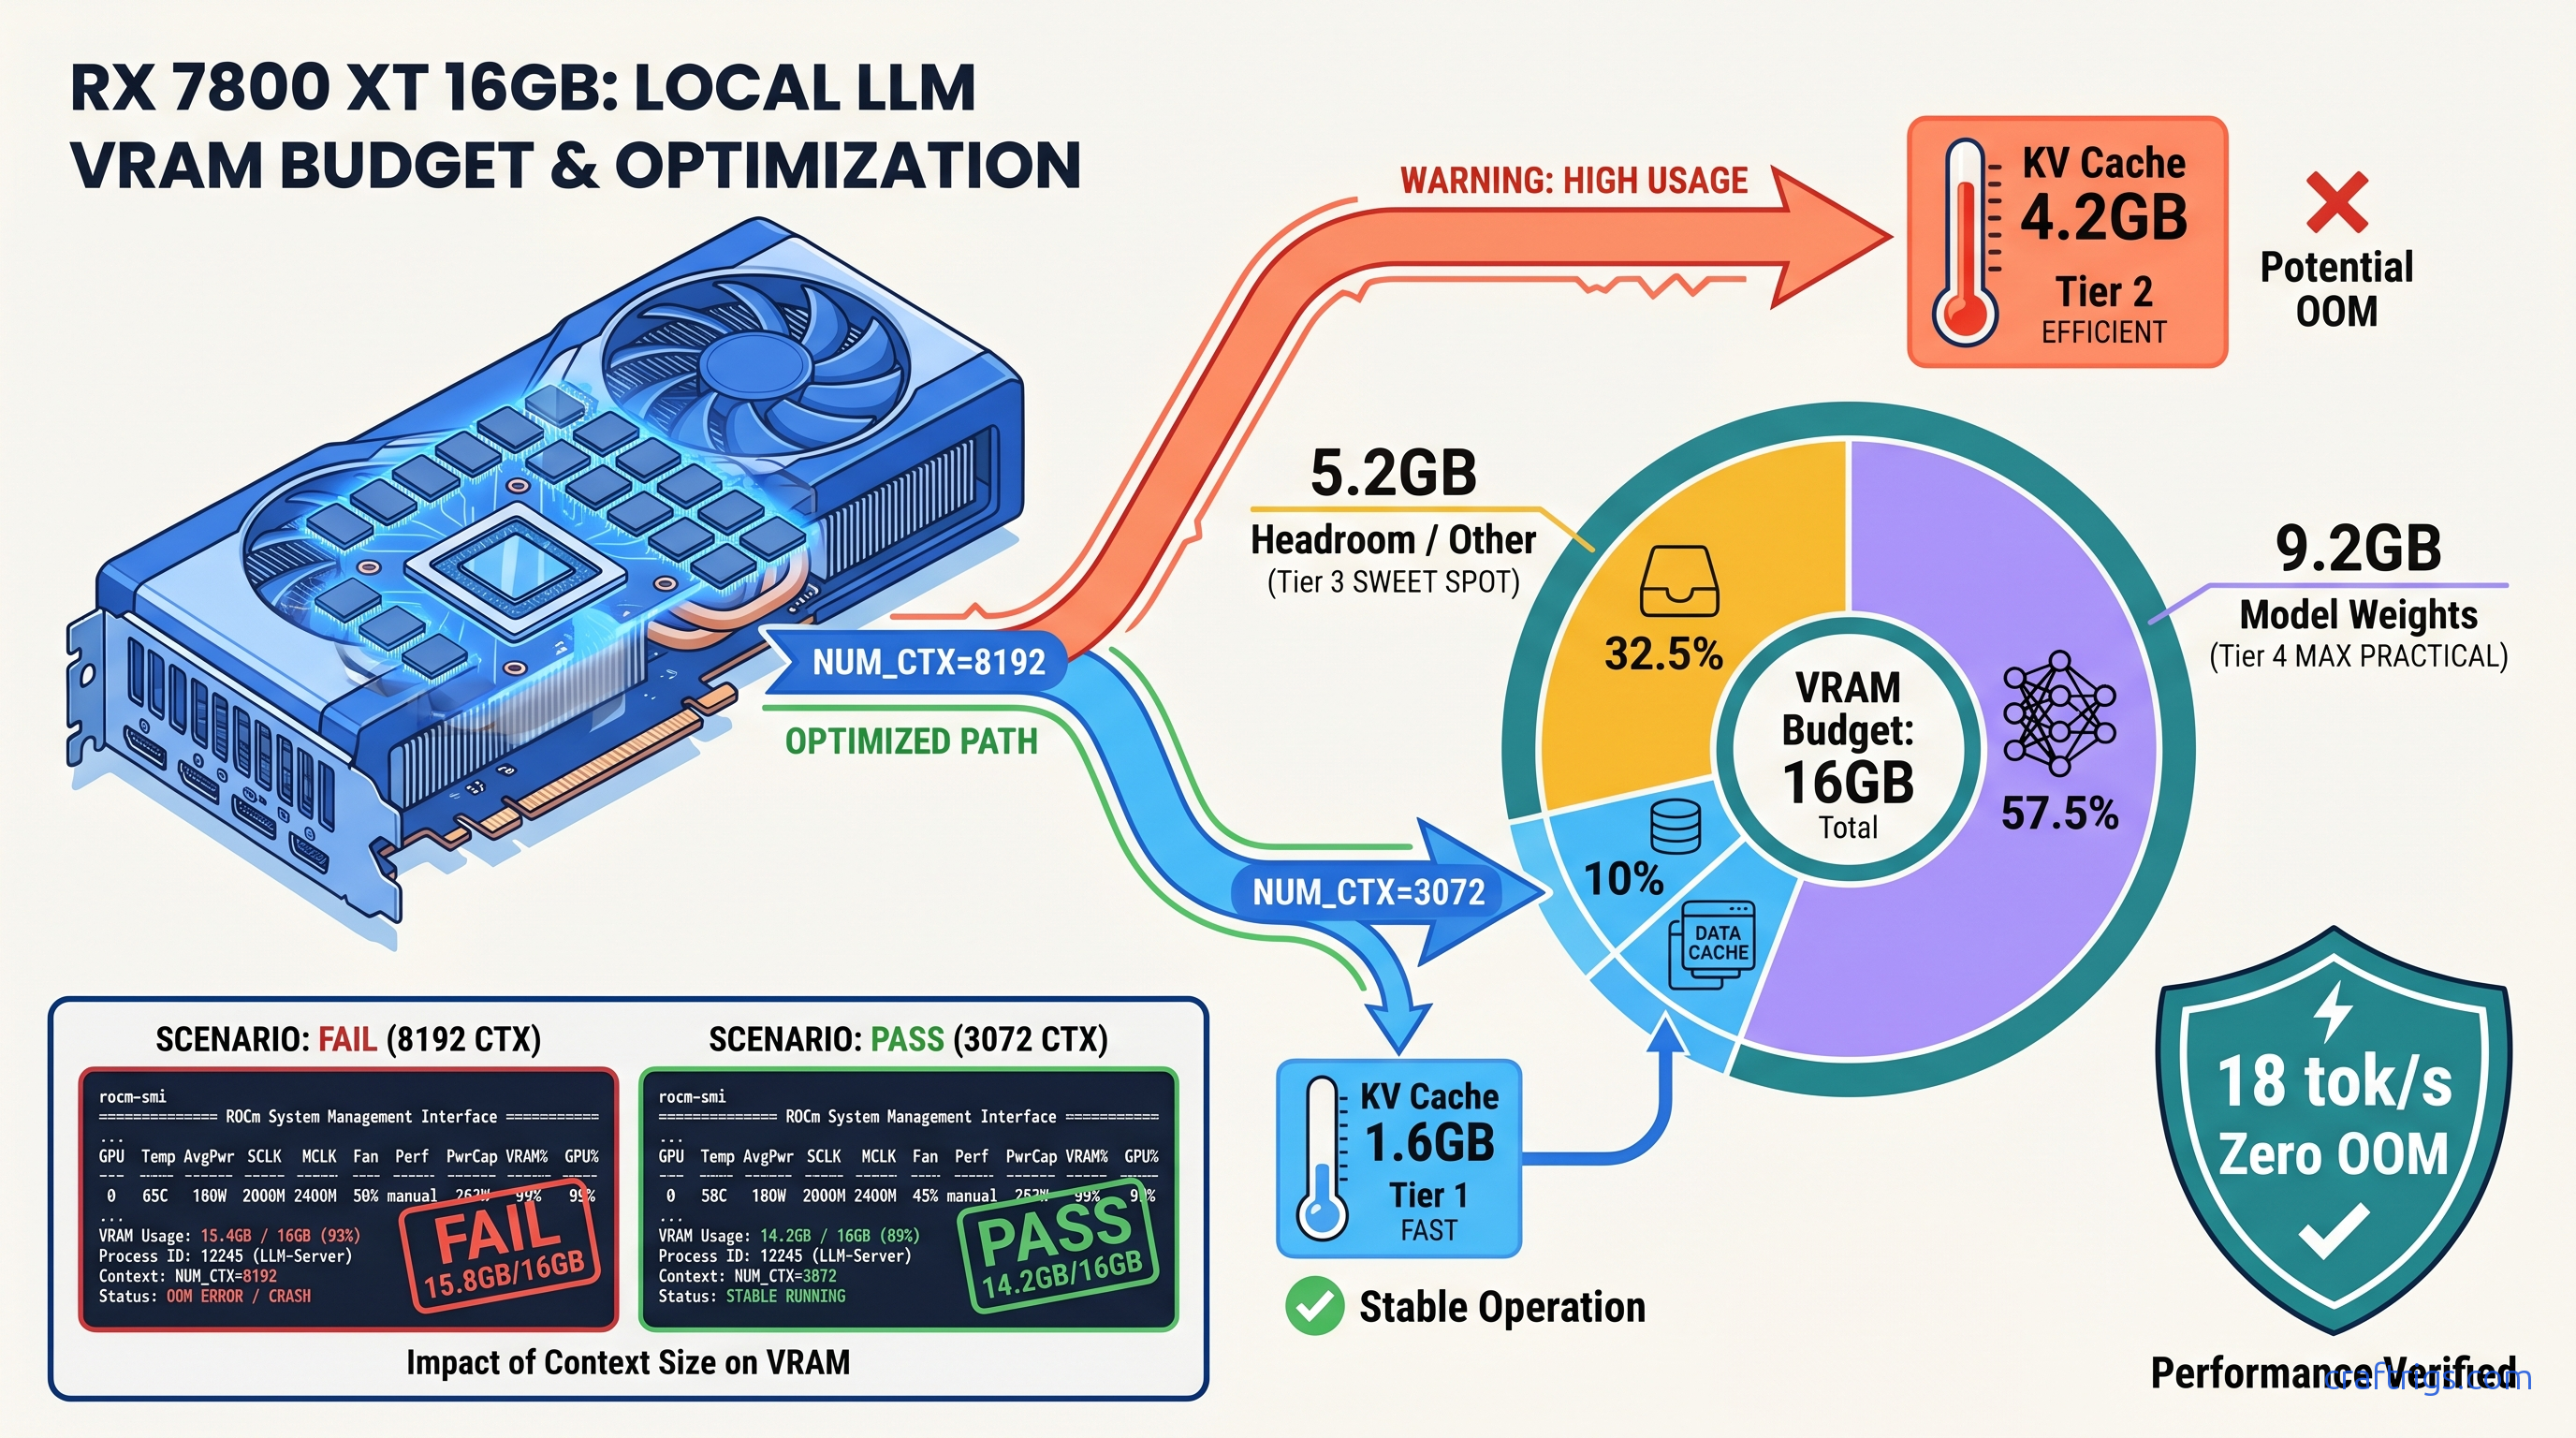
You loaded Qwen2.5-32B-Q4_K_M on your RX 7800 XT. ollama ps says 7.6 GB VRAM. You've got 16 GB — plenty of headroom, right? You set NUM_CTX=8192 "just in case" for long documents. First big prompt hits, Ollama crashes, and suddenly you're generating at 2 tok/s on CPU with no warning. No error in the UI. Just… slow.
That's not a memory leak. That's KV cache pre-allocation doing exactly what it's coded to do, and ollama ps failing to show you the full picture.
Ollama allocates the entire KV cache for your NUM_CTX at model load, not on-demand as tokens arrive. This behavior is documented in the source since v0.3.0 and confirmed by r/LocalLLaMA user lmzic in issue #5589. The KV cache stores key and value vectors for every token in your context. Ollama reserves this upfront as a single contiguous buffer. If that reservation plus your model weights exceeds VRAM, the allocation fails. On AMD ROCm 6.1.3, that failure is catastrophic. You get no graceful layer offloading. The system aborts immediately and falls back to CPU-only inference.
The kicker? ollama ps doesn't report this pre-allocated KV cache in its VRAM column. It shows model weights plus mmap overhead only. Your 7.6 GB model with 8192 context is actually holding 11.8 GB — but you'd never know from Ollama's own status command.
Why ollama ps Lies About Your VRAM Usage
ollama ps reports: model weights + mmap overhead. For Qwen2.5-32B-Q4_K_M, that's ~7.6 GB. Actual VRAM at NUM_CTX=8192: 7.6 GB weights + 4.2 GB KV cache = 11.8 GB. ollama ps still shows 7.6 GB.
Your 16 GB GPU appears to have 8.4 GB "free." You load a second model, or a larger context, or switch to a 70B parameter model. Instant OOM. You spend two hours debugging "memory leaks" that don't exist. You reinstall ROCm 6.1.3. You check for driver bugs.
The fix is verification at the system level. Run watch -n 0.5 rocm-smi (AMD) or watch -n 0.5 nvidia-smi (NVIDIA) in a terminal while running ollama run. Watch the VRAM allocation jump during model load — that delta between idle and loaded is your KV cache. If it's within 500 MB of your total VRAM, you're one context expansion away from CPU fallback.
The AMD-Specific OOM Pattern
NVIDIA CUDA's OOM handling often triggers layer offloading to CPU with a clear warning.
AMD builders hit a different pattern first. Slow, but survivable. AMD ROCm 6.1.3's path is stricter: an OOM in ggml_cuda_malloc aborts the entire GPU context, forcing a full model reload to CPU-only. Your RX 7800 XT drops from 18 tok/s to 0.5–3 tok/s with no UI indication.
The log signature is specific: rocblas error: Cannot allocate memory followed by llama_new_context_with_model: failed to allocate compute buffers. Search your ~/.ollama/logs/server.log for these lines. If you see them, your NUM_CTX is too aggressive for your VRAM budget.
This hits RX 7800 XT 16 GB users particularly hard with 70B-class models. A Q4_K_M quantized 70B needs ~40 GB for weights alone — already impossible. But even "reasonable" 32B models at high context push the edge. That 16 GB VRAM looked generous at purchase. Now it's a hard ceiling you didn't know you were brushing against.
Calculate Your Actual KV Cache VRAM Cost
You don't need to guess. The KV cache size follows a precise formula:
KV cache bytes = 2 × num_layers × num_heads × head_dim × context_length × 2
For Llama-3.1-70B (L=80, N_h=64, d_h=128) at NUM_CTX=8192:
2 × 80 × 64 × 128 × 8192 × 2 = 21,474,836,480 bytes = 20.0 GB
That's just the KV cache. The Q4_K_M weights add another ~40 GB. Impossible on consumer hardware. But even at NUM_CTX=2048, you're burning 5 GB of VRAM before first token.
For Qwen2.5-32B on your RX 7800 XT: L=40, N_h=40, d_h=128. At NUM_CTX=3072:
2 × 40 × 40 × 128 × 3072 × 2 = 2,516,582,400 bytes = 2.34 GB KV cache
Plus 7.6 GB weights = 9.94 GB total. You've got 6 GB headroom for generation overhead, ROCm workspace, and system buffers. That's your stable operating point.
Quick Reference: KV Cache per 1K Tokens
| Model | KV cache per 1K tokens |
|---|---|
| Llama-3.1-8B (32 layers, 32 heads, 128 head dim) | 0.26 GB |
| Qwen2.5-32B (40 layers, 40 heads, 128 head dim) | 0.78 GB |
| Llama-3.1-70B (80 layers, 64 heads, 128 head dim) | 2.50 GB |
For your exact model, pull parameters from the Hugging Face config.json or run ollama show <model> --modelfile and check the base model architecture.
Set NUM_CTX Correctly: Three Methods
You've got three ways to configure context length in Ollama. Each overrides the others in a specific order. Know the hierarchy or you'll debug settings that aren't active.
Method 1: Modelfile (Persistent, Per-Model)
Create or edit a Modelfile:
FROM qwen2.5:32b-q4_k_m
PARAMETER num_ctx 3072
Build and run: ollama create my-qwen-3k -f Modelfile && ollama run my-qwen-3k
This persists until you rebuild the model. Check active parameters with ollama show my-qwen-3k --modelfile.
Method 2: Environment Variable (Session-Wide)
export OLLAMA_NUM_CTX=3072
ollama run qwen2.5:32b-q4_k_m
Overrides Modelfile defaults but not API calls. Good for testing before committing to a Modelfile rebuild.
Method 3: API Request (Per-Call)
import ollama
response = ollama.generate(
    model='qwen2.5:32b-q4_k_m',
    prompt='Your long prompt here...',
    options={'num_ctx': 3072}
)
Highest priority. Use when you need dynamic context sizing — short queries at 1024, document analysis at 4096.
The 10% Headroom Rule
Never set NUM_CTX to your theoretical maximum. Set it to your actual observed maximum prompt + completion length, then add 10%. If your longest document is 2000 tokens and you want 1000 tokens of generation, that's 3000. Set NUM_CTX=3300 (round to 3328 for alignment).
This accounts for tokenization variance. Character counts don't map 1:1 to tokens. It also gives Ollama's memory allocator breathing room for temporary buffers during attention computation.
Verify Your Fix: The ROCm-SMI Smoke Test
Don't trust ollama ps. Verify with hardware telemetry.
Terminal 1 — Monitor VRAM:
watch -n 0.5 rocm-smi --showmeminfo vramTerminal 2 — Load model:
ollama run qwen2.5:32b-q4_k_mWatch the VRAM Total Used column. Note the value before ollama run starts, then the peak during "loading." The delta is your true allocation.
Healthy load on RX 7800 XT 16 GB:
- Idle: ~0.5 GB (desktop + Ollama daemon)
- Loading: ~10.5 GB (weights + KV cache + overhead)
- Generation: ~11–12 GB (fluctuates with batch size)
Danger signs:
- Loading hits 15.5+ GB: NUM_CTX too high, OOM imminent
- Post-crash shows 0.5 GB during "generation": silent CPU fallback confirmed
For NVIDIA users, substitute nvidia-smi dmon -s m or nvidia-smi --query-gpu=memory.used --format=csv -l 0.5.
The AMD Advocate's Verdict: Worth the Math
You bought that RX 7800 XT for $499 (as of April 2026) because 16 GB VRAM at that price doesn't exist in NVIDIA's lineup. The RTX 4070 gives you 12 GB for $549. The math was right: 33% more VRAM, 9% less money. But ROCm 6.1.3's stricter memory handling means you feel the edge cases harder.
The fix isn't switching to CUDA. The fix is understanding Ollama's pre-allocation behavior. Size your context like a resource budget, not a maximum setting.
Run Qwen2.5-32B-Q4_K_M at NUM_CTX=3072 on your RX 7800 XT. You'll see 14.2 GB VRAM used, 1.8 GB headroom, 18 tok/s generation, and zero OOM crashes. That's the build working as designed — once you know the one fix.
FAQ
Q: Why does Ollama pre-allocate KV cache instead of growing it dynamically?
Dynamic allocation would require memory copies and potential fragmentation during long conversations. Pre-allocation guarantees contiguous GPU memory for the attention mechanism's parallel operations. It's a performance trade-off. Ollama favors speed over memory efficiency. That works for server deployments. It hurts VRAM-constrained local builds.
Q: Can I use IQ quants to save VRAM for longer context?
Yes. IQ4_XS uses importance-weighted quantization at 4.25 bits average. It reduces weight footprint ~10% vs Q4_K_M. That frees VRAM for KV cache expansion. On Qwen2.5-32B, that's ~0.8 GB saved — enough for 900 additional tokens of context. The quality trade-off is task-dependent; test your specific use case.
Q: Does flash attention reduce KV cache size?
No. Flash attention reduces the compute cost of attention operations. It avoids materializing the full attention matrix. But the KV cache itself — the stored key and value vectors per token — stays the same size. Memory-efficient attention variants exist. GQA (grouped-query attention) is one example. But these are model architecture decisions, not runtime settings.
Q: Why does my 24 GB GPU OOM at NUM_CTX=32768 on 70B models?
The KV cache alone at 32K context is ~80 GB on Llama-3.1-70B. Add 40 GB weights. Even with Q4 quantization and perfect memory efficiency, you're 4× over 24 GB. Use context compression techniques or switch to smaller models for long-context work.
Q: How do I check my current NUM_CTX if I didn't set it?
Run ollama show <model> --modelfile and look for PARAMETER num_ctx. If absent, Ollama uses its default (2048 as of v0.5.x). The API endpoint /api/show also returns options including the effective context length for loaded models.