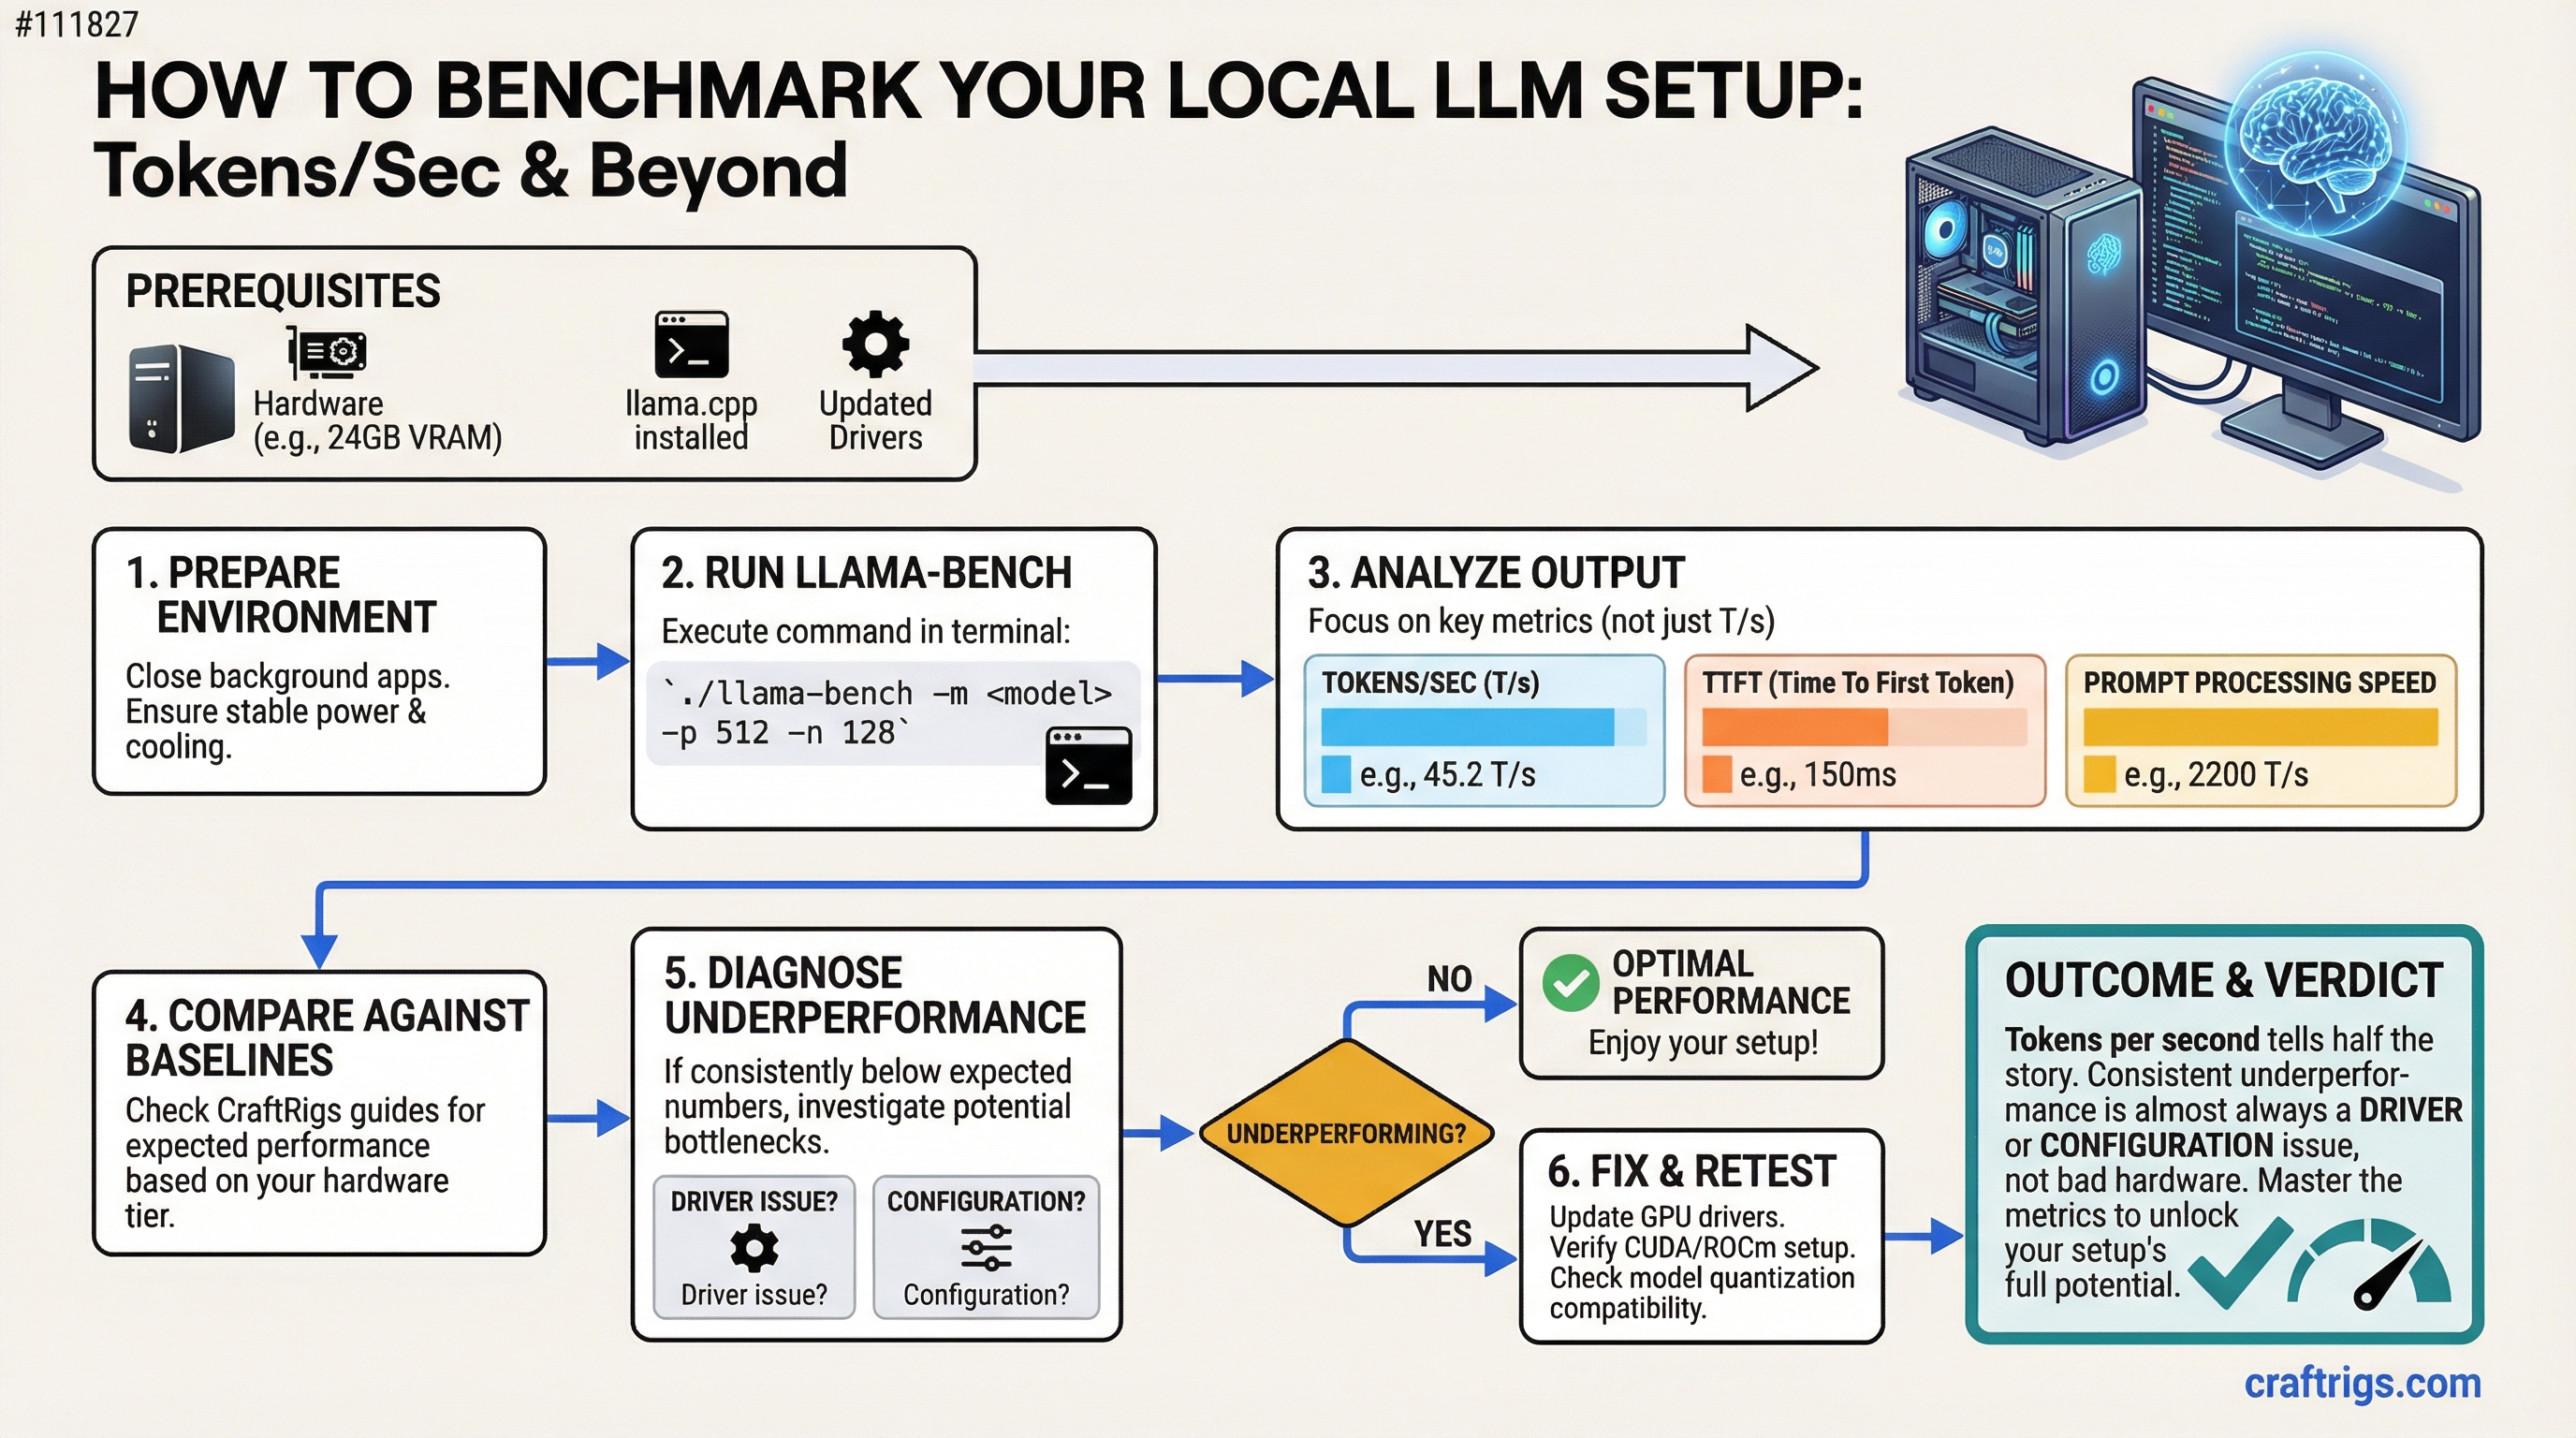
TL;DR: Tokens per second is the number that matters for local LLM performance. Run llama.cpp's built-in bench tool, compare against the baselines in this guide, and if you're consistently below expected numbers, the fix is almost always a driver or configuration issue — not bad hardware.
Most people who build a local LLM rig never actually measure what it's doing. They notice it feels fast or slow, but they don't have a baseline to compare against. This guide gives you a simple way to measure performance, understand what the numbers mean, and diagnose when something is underperforming.
The Primary Metric: Tokens Per Second
Tokens per second (T/s or tok/s) measures how quickly a model generates output tokens during inference. When you ask a model a question and watch the words stream out, each word fragment is roughly a token. Higher T/s means faster output, shorter wait times, better usability.
There are actually two separate measurements worth knowing:
Prompt processing speed (PP or "prefill"): How fast the model processes your input prompt before it starts generating. Measured in tokens/sec for the input. This matters more when you're sending long documents or code for analysis.
Token generation speed (TG): How fast the model generates each output token. This is the number you feel in real-time. This is the number that matters most for day-to-day use.
When benchmarking, you'll see both. Focus on TG for the experience metric, PP for understanding your system's throughput capacity.
Running llama.cpp Bench
llama.cpp includes a built-in benchmarking tool: llama-bench. This is the right way to measure your system.
Basic benchmark command:
./llama-bench -m path/to/your/model.ggufThis runs a standard test with:
- Prompt processing test (512 token prompt by default)
- Token generation test (128 tokens by default)
- Reports both PP and TG in tokens/second
More comprehensive benchmark:
./llama-bench -m path/to/model.gguf -p 512,1024,2048 -n 128,256 -ngl 99This tests multiple prompt lengths and generation lengths. The -ngl 99 flag ensures all layers are on the GPU (essential for accurate GPU benchmarks).
Running with specific GPU layers: If you want to compare full GPU inference vs CPU offload:
# Full GPU
./llama-bench -m model.gguf -ngl 99

# CPU only (no GPU offload)
./llama-bench -m model.gguf -ngl 0
The difference between -ngl 0 and -ngl 99 shows you exactly how much your GPU is helping.
What Good Performance Looks Like
These are approximate baselines based on common hardware configurations running Q4_K_M quantized models. Your results will vary based on exact model, quantization, context length, and system configuration.
RTX 4090 (24GB):
- 7B model: ~120–150 T/s generation
- 13B model: ~80–100 T/s generation
- 34B model: ~35–50 T/s generation
- 70B Q4 (split to CPU or dual GPU): ~15–25 T/s generation
RTX 3090 (24GB):
- 7B model: ~85–110 T/s generation
- 13B model: ~55–75 T/s generation
- 34B model: ~25–40 T/s generation
- 70B Q4 (split): ~10–18 T/s generation
RTX 3080 (10GB):
- 7B model: ~65–85 T/s generation
- 13B model (partial offload): ~25–40 T/s generation (CPU handles overflow layers)
Apple M3 Pro (18GB unified memory):
- 7B model: ~55–75 T/s generation
- 13B model: ~30–45 T/s generation
CPU-only (Ryzen 9 7950X):
- 7B model: ~8–15 T/s generation
- 13B model: ~4–8 T/s generation
The GPU vs CPU gap is enormous. This is why VRAM matters so much — you need the model to fit entirely on the GPU to get usable generation speeds.
GPU vs CPU Inference: The Real Comparison
GPU inference isn't just faster — it's a completely different class of speed. The reason is memory bandwidth.
- RTX 4090 VRAM bandwidth: ~1,008 GB/s
- RTX 3090 VRAM bandwidth: ~936 GB/s
- Ryzen 9 7950X system RAM bandwidth: ~77 GB/s (DDR5-6000 dual channel)
LLM inference is fundamentally memory-bandwidth bound. The GPU has 12–15x more memory bandwidth than even fast system RAM. Every time the model generates a token, it reads through the entire set of model weights. Faster memory bandwidth = faster token generation.
This is why adding more CPU cores doesn't help much with local LLM speed. The bottleneck is memory bandwidth, not compute cores.
Common Causes of Underperformance
If your numbers are significantly below the baselines above:
Not enough GPU layers (-ngl not set correctly):
If you're not passing -ngl 99 (or a high enough number), layers are being handled by the CPU. Run with verbose output to see layer allocation: add -v to your llama.cpp command and look for "offload X layers to GPU" in the output.
Wrong GPU being used:
If you have an integrated GPU and a discrete GPU, llama.cpp might be using the wrong one. Check with nvidia-smi that your discrete GPU is showing activity during inference.
Thermal throttling:
If the GPU overheats, it reduces its clock speed to protect itself. Check GPU temperature during inference — anything over 85°C on the junction or 90°C on the GPU core may cause throttling. Monitor with nvidia-smi dmon or GPU-Z.
Driver issues: Outdated CUDA drivers can cause significant performance penalties. Keep NVIDIA drivers current. For llama.cpp specifically, CUDA 12.x performs better than 11.x in most cases.
Wrong quantization for your hardware: Q8_0 quantization is higher quality but uses more VRAM and bandwidth. Q4_K_M is the standard balance. If a Q8 model barely fits in VRAM, it may run slower than a Q4 version because of VRAM pressure causing cache eviction.
Context length too high: Longer context lengths significantly slow down token generation because of the attention mechanism's quadratic scaling. A context of 32k is dramatically slower than 4k. If you're seeing slow generation, check your context length setting.
The Benchmark Comparison That Actually Matters
The most useful benchmark isn't against published numbers — it's before and after you make a change.
Before upgrading RAM: run llama-bench. After upgrading: run again. Before installing new drivers: benchmark. After: benchmark.
This gives you a real-world measurement of whether changes actually helped on your specific system with your specific workload. Don't chase someone else's numbers — understand your own hardware.