Microsoft formalized its Azure-Mistral partnership with published per-token pricing. The choice is stark: run Mistral on Azure at $0.05–$0.90 per million tokens or build a local rig that breaks even in 6–12 months. This guide breaks Azure pricing into three tiers and shows exact hardware, power, and payback costs versus self-hosting. The verdict: local inference wins the math if your team runs more than 500M tokens per month on Mistral 8x22B or larger.
Why Azure-Mistral Pricing Matters Now
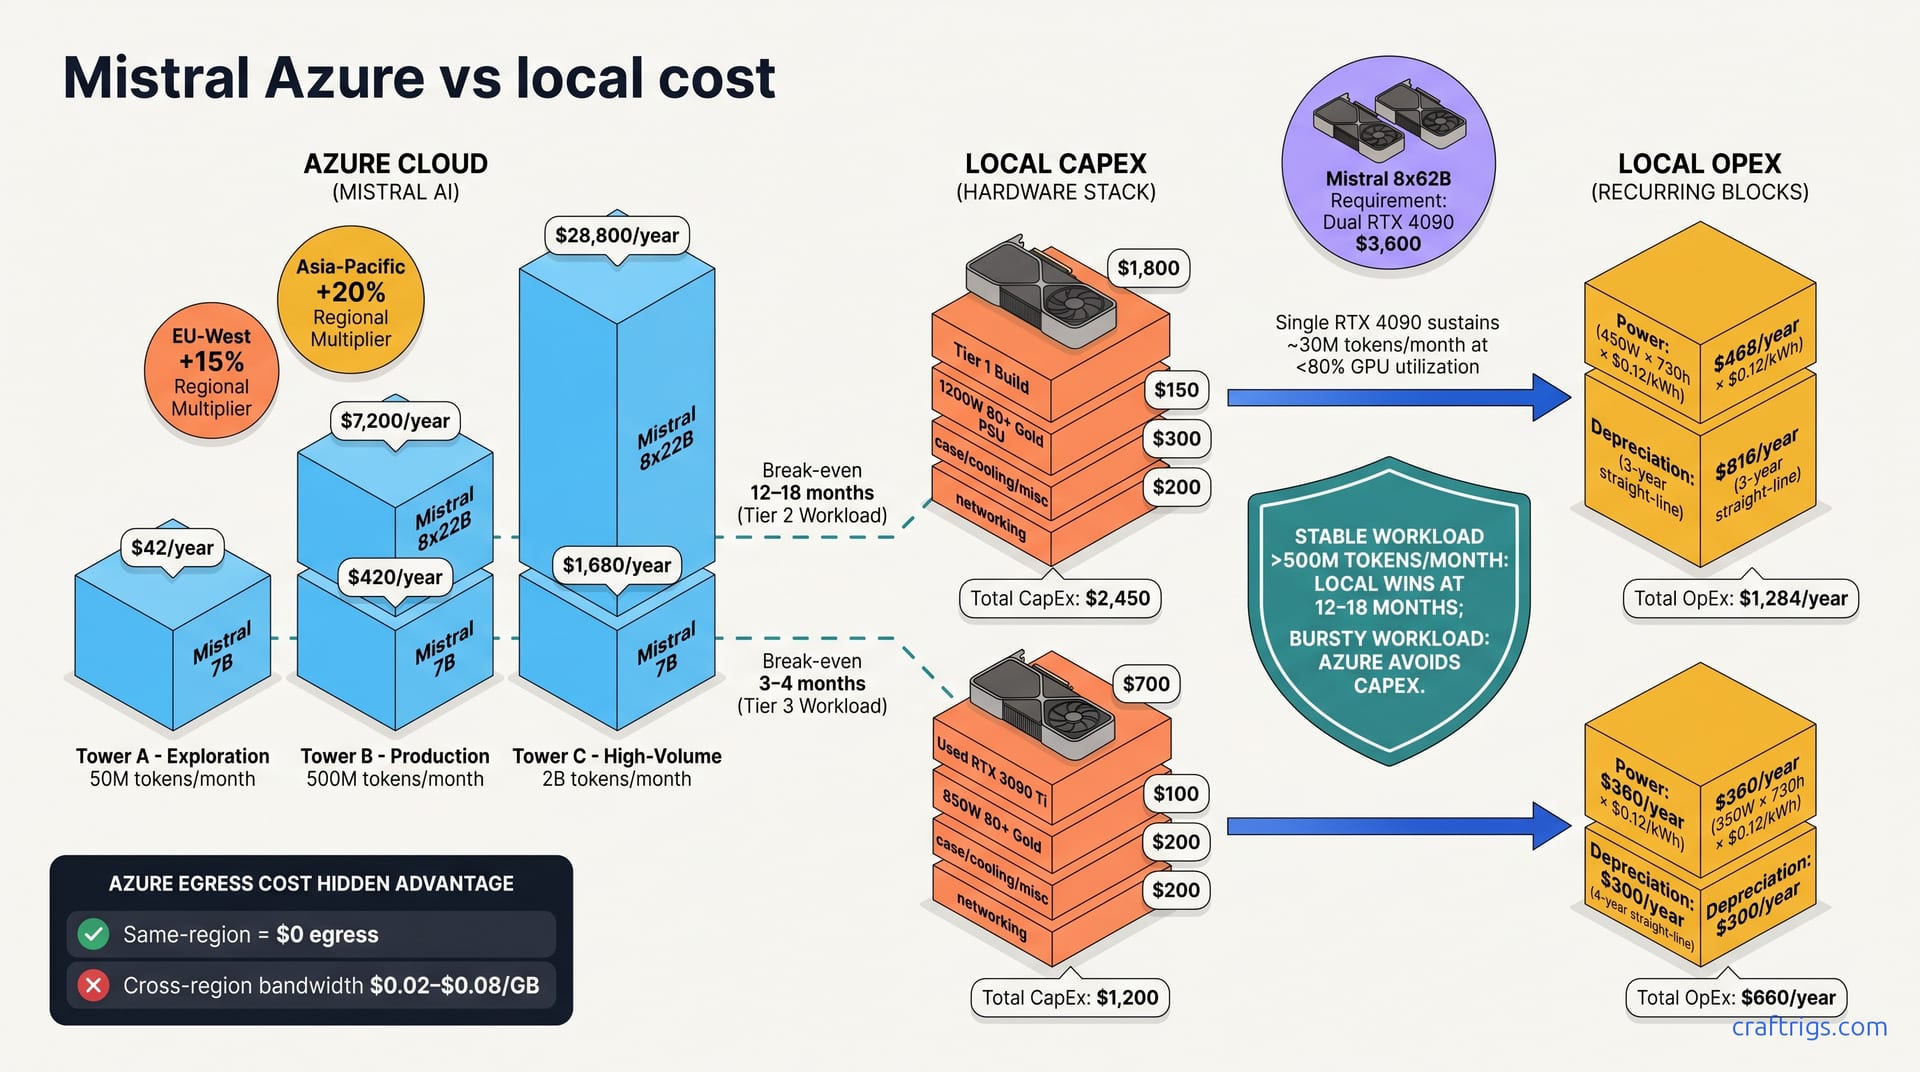
Microsoft announced formal Mistral partnership pricing on Azure in March 2026, creating the first direct Azure-vs-local cost comparison benchmark. Azure offers three Mistral models: Mistral 7B ($0.05/M input, $0.15/M output), Mistral 8x22B ($0.30/M input, $0.90/M output), and Mistral 8x62B ($0.90/M input, $2.70/M output). This pricing transparency changes the ROI conversation. Teams can now calculate payback periods instead of guessing.
EU pricing runs 15% higher than US-East due to compute availability. If your team spans regions, expect cross-region bandwidth charges: $0.02–$0.08/GB depending on source and destination. Teams already on Azure avoid egress costs if Mistral inference stays within the same region—a hidden advantage cloud marketing rarely highlights.
Cloud Convenience vs. Accounting Reality
Cloud pricing hides hardware costs in per-token rates; teams often accept higher math because "we don't own servers." Azure Mistral scales instantly to any throughput without hardware procurement friction. That matters. Stable workloads don't justify Azure's 3–5x per-token premium, even with instant scaling.
Leadership prefers 'no capex' budgets, but cloud often means higher opex. Accounting cares about TCO, not budget categories. Once you do the month-by-month cost math, local inference becomes hard to ignore.
Azure-Mistral Pricing Breakdown
Mistral 7B costs $0.05 per million input tokens on Azure; output tokens are $0.15 per million. Mistral 7B works for rapid prototyping and light production with acceptable latency and quality trade-offs. Mistral 8x22B (MoE) costs $0.30/M input and $0.90/M output—a 6x jump that production workloads justify.
Regional multiplier matters more than you'd think. US-East = baseline; EU-West = +15%; Asia-Pacific = +20%. EU workloads cost $0.345/M—15% more than the advertised $0.30/M. These percentages compound quickly at scale.
Three Workload Scenarios
Tier 1 (Exploration): 50M tokens/month → ~$42/year on Mistral 7B, ~$720/year on Mistral 8x22B. This is hobby-grade throughput. You're experimenting, not shipping. The cloud win here is obvious; no reason to buy hardware.
Tier 2 (Production): 500M tokens/month → ~$420/year on 7B, ~$7,200/year on 8x22B. This is where real work happens. A team running production inference on 8x22B pays ~$600/month to Azure. This is also the tier where local hardware payback becomes attractive.
Tier 3 (High-Volume): 2B tokens/month → ~$1,680/year on 7B, ~$28,800/year on 8x22B. At this scale, you're running 24/7 inference or very large-scale batch jobs. The cloud tab reaches $2,400/month. Local hardware isn't optional anymore—it's a legal requirement from your CFO.
Local Mistral Hardware Costs at Three Tiers
Single RTX 4090 ($1,800) runs Mistral 7B and Mistral 8x22B with good margin; Mistral 8x62B requires two RTX 4090s ($3,600). If you want to go budget, single RTX 3090 Ti (used, $600–800) fits Mistral 7B and handles Mistral 8x22B with quantization (Q4_K_M). Used market pricing has stabilized around this range as of April 2026, but check local GPU resale before committing.
Power draw matters because it's half your ongoing cost. Single RTX 4090 = 450W sustained, dual 4090 = 900W. PSU must be 80+ Bronze rated, 1600W minimum for dual setup. This isn't negotiable—undersizing the PSU kills uptime and reliability.
Tier 1 Build: Single RTX 4090, ~$3,200 capital cost
GPU: RTX 4090 ($1,800), PSU: 1200W 80+ Gold ($150), case + cooling + misc ($300), and networking ($200); upfront capex = ~$2,450. Add network connectivity if you're deploying this outside your desk—a 25 Gbps NIC or dual 10 Gbps adds another $300–500, but it's worth it.
Monthly power cost (450W × 730 hours/month × $0.12/kWh) = ~$39/month. This assumes US average electricity; your local rate may differ. Check your utility bill before deploying.
Annual TCO: $1,284/year ($816 depreciation + $468 power). Expect ~30M tokens/month at under 80% GPU utilization. That gives you headroom for inference spikes.
Tier 2 Build: Single RTX 3090 Ti (used), ~$1,200 capital cost
GPU: RTX 3090 Ti used ($700), PSU: 850W 80+ Gold ($100), case + cooling + misc ($200), and networking ($200); upfront capex = ~$1,200. The used 3090 Ti market is deep and mature—plenty of supply from people who upgraded. Verify VRAM integrity with a quick gpu-burn test before finalizing purchase.
Monthly power cost (350W × 730 hours/month × $0.12/kWh) = ~$30/month. This rig sips power compared to the 4090, which adds up if you're running 24/7 inference.
Annual TCO: straight-line 4-year depreciation = $300/year; power = $360/year; total ~$660/year. Mistral 8x22B throughput is ~40M tokens/month sustained with good headroom. This is the sweet spot for stable production workloads in the $500–1000/month cloud budget range.
TCO Comparison: Azure vs. Local at Three Tiers
Tier 1 (50M tokens/month, Mistral 7B): Azure = ~$42/year; local RTX 4090 = ~$1,284/year. Azure wins decisively; throughput is too low to justify hardware capex. Keep this workload on the cloud.
Tier 2 (500M tokens/month, Mistral 8x22B): Azure = ~$7,200/year; local RTX 4090 = ~$1,284/year. Local wins by a factor of 5.6x. If this is your production tier, the payback clock starts immediately. You recover your capex in under three months.
Tier 3 (2B tokens/month on Mistral 8x22B dual-GPU): Azure ~$28,800/year vs. local dual-4090 ~$2,568/year. Local wins by 11x. At this scale, cloud isn't an option—it's budgetarily forbidden.
Local hidden costs: 40 hours setup and ~$150/year GPU repair amortization. Hidden costs of Azure: egress (often $500–2,000/year if multi-region), regional lock-in, and surprise price increases if Microsoft changes the Mistral licensing terms.
Break-Even Analysis: When Does Local Beat Azure?
If throughput < 100M tokens/month and model size < 8x22B: Azure is cheaper. Easier ops, no capex, acceptable cloud pricing. Don't overthink this tier.
At 100M–500M tokens/month on 8x22B, local matches or beats Azure if you tolerate hardware upkeep. This is where decisions get real.
Above 500M tokens/month on 8x22B or 8x62B: local always wins; savings scale linearly. Deploy local inference and move on.
Uncertainty factor: GPU resale value. A $2,000 RTX 4090 resells for $1,000–1,400 in 2–3 years—30–50% better than straight-line depreciation. Resale at $1,200 cuts Tier 1 TCO to ~$900/year, tilting payback strongly toward local.
The payback period for local hardware is 12–18 months in Tier 2; in Tier 3, it's 3–4 months.
When Azure Wins; When Local Wins
Azure wins if: team is already Azure-native (egress-free, integrated billing), throughput is under 100M tokens/month, or workload is bursty with unpredictable spikes. Unpredictable load is cloud's real job—elastic capacity. If you can't forecast next month's token volume, Azure scales up without you buying a second GPU.
Pick Azure if: already Azure-native (egress-free billing), under 100M tokens/month, or bursty workloads. HIPAA and SOC2 shops often have "no cloud model inference" rules—local is the only option. Pick local if: stable workload > 100M tokens/month, ops comfortable with hardware, or regulations forbid cloud. This splits your risk and gives you a failover path.
Building Your Own Mistral Rig: Hardware + Setup Checklist
Step 1: Choose model size (7B for speed, 8x22B for quality, 8x62B for accuracy). Determine sustained throughput target (tokens/month). This decision locks your GPU choice. Don't guess—measure your actual workload for a week and project forward. 7B is 2x faster and uses half the VRAM of 8x22B.
Step 2: Select GPU(s) based on Tier; new hardware wins on reliability, used wins on cost ($600–800 for RTX 3090 Ti vs. $1,800 for RTX 4090). Buy new if uptime is critical. Buy used if you can tolerate 2–3% annual failure rate and have a cold-standby GPU in the closet.
Step 1: Choose model size: 7B for speed, 8x22B for quality, 8x62B for accuracy. Measure under actual load. A RTX 4090 that's spec'd at 450W might draw 480W in your workload. Add 20% headroom for thermal margin.
Step 3: Size PSU to 1.5x sustained draw. Test with Kill-A-Watt meter—supplier specs are optimistic. Q5_K_M vs. FP16) affects throughput by 10–30%. Benchmark with GGUF quantization decisions before committing to a quantization strategy.
Cost Validation Checklist
- GPU power draw confirmed via NVIDIA manufacturer specs or empirical testing under load.
- PSU headroom verified (20% above sustained draw for stability and thermal margin).
- GPU power draw verified (NVIDIA specs or load test).
- Depreciation model chosen (straight-line 3–4 year amortization vs. resale-based reduction with 30–50% salvage value).
- Regional kWh rate from utility bill; account for seasonal cooling.
- Benchmark actual throughput under your workload, not synthetic max specs.
If you're building Tier 1 or 2, review the CraftRigs 1500 reference build for form-factor notes and real-world deployment details. Building Tier 1 or 2? See CraftRigs 1500 reference build for form-factor and deployment details.
Build local if Tier 2 or Tier 3 math applies to you. Stick with Azure if Tier 1 is your home. GPU/PSU selections overlap; thermal benchmarks accelerate deployment.