Local LLM hosting breaks even in 18–24 months if your team spends $2K+/quarter on API. An enterprise case shows one team migrating $47K/quarter from API to hardware. We break down that logic into three budget tiers ($1.2K, $2K, $4.5K+), show payback math for your token volume, and identify when API still makes sense. Use the calculator to see your exact breakeven month.**
The Enterprise Case: $47K/Quarter Breakdown
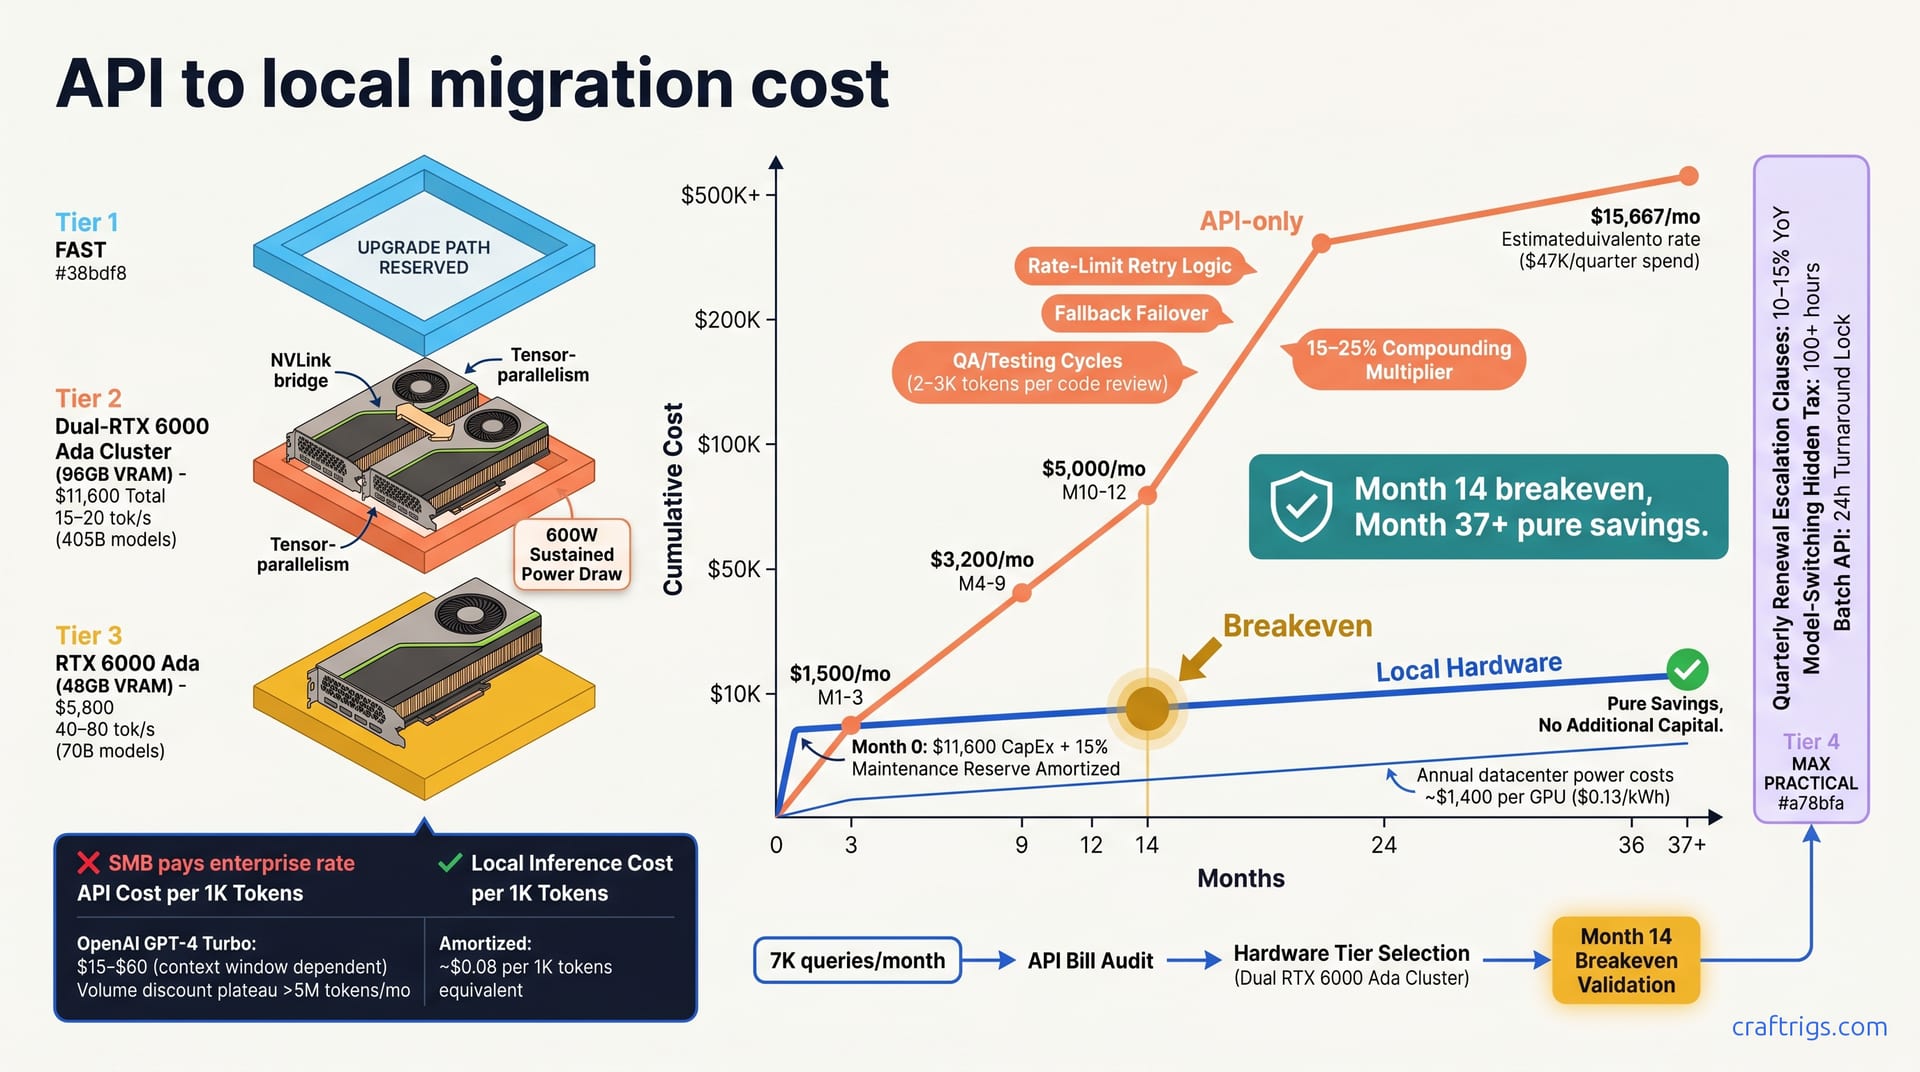
A public migration story revealed a team at 7K queries/month spending $47K/quarter on API—roughly $6.71 per 1K tokens across mixed models. They migrated to a dual-RTX 6000 Ada cluster amortized over 36 months, achieving breakeven in month 14. From month 37 onward, it's pure savings with no additional capital required, just operational cost of roughly $500/month.
This payback model is template-reusable at smaller scales. Swap in your own token throughput and hardware tier, and the math translates directly. You can't replicate their 7K-query volume, but you can apply their cost-reversal mechanics, hardware selection, and ROI math.
Anatomy of the $47K Bill
The cost-per-1K-tokens at enterprise tier on GPT-4 Turbo pricing ranges $15–$60 depending on context window and model. Volume discounts plateau at a certain ceiling; enterprise and small team per-token prices converge above 5M tokens/month, meaning you won't get relief by scaling alone.
But that bill number includes hidden costs rarely surfaced in quarterly reviews. Rate-limit retries, model failover, support escalation, and QA testing all burn tokens. QA alone burns 2–3K tokens per code review (often omitted from budgets) and inflates total cost by 15–25%. When you reconcile actual spend against estimated inference volume, the difference is brutal.
Hardware Footprint for $47K Replacement
The RTX 6000 Ada at $5,800 per unit runs 70B-parameter models at 40–80 tok/sec with full VRAM headroom. A dual-RTX 6000 cluster serves 405B-parameter models at 15–20 tok/sec via multi-card tensor parallelism—the same scale that the enterprise was consuming on API.
Power draw sits at 600W sustained per GPU. At annual datacenter cost of $0.13/kWh, that runs ~$1,400 per GPU yearly for electricity alone. A maintenance reserve of 15% of CapEx amortized over 36 months accounts for driver updates, thermal paste reapplication, and disk replacement—the unglamorous but real costs of keeping hardware alive.
API Cost Drivers & Why They Compound
API bills appear linear until mid-scale. Every new inference-consuming feature adds $500–$1K monthly almost invisibly. Rate limits breed retry loops and cache debt that pile on operational work without saving money. You're paying more while getting slower, more fragile results.
Switching models (GPT-4 → Claude 3.5 → Llama) forces re-prompting, re-benchmarking, test rewrites—100+ hidden hours that wreck engineering velocity without showing on the API bill. Quarterly renewals embed escalation clauses of 10–15% year-over-year. Most teams skip the 3-year cost trajectory until the migration pitch hits the CTO.
The Cost Curve Over 12 Months
In months 1–3, $1,500/month feels negligible. Teams overbuild endpoints for hypothetical scale and lock in debt that drives consumption up. By months 4–9, you hit $3,200/month and trigger the first budget meeting. But by then, all your inference endpoints are already shipped and hard to redesign.
Months 10–12 force hard choices: rate limits, model downgrade, or start migration planning. By month 13, your cumulative API bill surpasses a Tier 2 hardware system plus annual ops costs. You've hit the inflection point and didn't realize it was coming.
Why API Pricing Doesn't Scale Down
Vendors price for enterprise. SMB teams pay enterprise-grade per-token rates with no volume discount threshold. Smaller open-source models (Llama 7B, Mistral 7B) cost nearly as much on API as larger ones due to platform overhead and margins. Your smaller, cheaper model doesn't save you anything at $0.15 per 1K tokens.
Context-window pricing penalizes retrieval-augmented generation workflows that reuse context. Longer conversations get exponentially more expensive. Batch APIs add 24-hour delays; real-time inference stays on pricey on-demand tiers. If you need latency under a second, you're stuck paying the premium.
Hardware Payback Model: 3 Tiers
Tier 1 ($1,200): Used RTX 3090 with 24 GB VRAM, runs Llama 70B Q4, replaces roughly $800/month API spend. Tier 2 ($2,000): New RTX 5880 Ada with 48 GB VRAM, runs Llama 405B Q4_K_M, replaces roughly $2,000/month API spend. Tier 3 ($4,500+): Dual RTX 6000 Ada with 96 GB combined, runs 405B native fp8 with batching, replaces roughly $5,000/month API spend.
Payback occurs 18–24 months into deployment at sustained usage. Beyond month 36, hardware cost is fully amortized into operational expense. You recoup the capital, then it's just electricity and maintenance costs.
Tier 1 ($1.2K) Payback Scenario
Upfront cost is $1,200 hardware plus $300 integration—NVIDIA drivers, Ollama setup, SSD storage. Expect $40/month electricity (600W × 730 hours ÷ 1000 × $0.13/kWh) plus $20 maintenance, totaling $60.
Payback math: your cumulative savings reach hardware cost at month 16. Compare that to continuing API-only: month 36 cumulative savings sit at $27,600. A used RTX 3090 value comparison pays for itself and then some.
Tier 2 ($2K) Payback Scenario
Upfront is $2,000 hardware plus $400 integration—multi-card PCIE wiring, inference optimization tuning, validation testing. Expect $80/month electricity (1200W at $0.13/kWh) plus $30 maintenance, totaling $110.
Payback happens at month 18 when cumulative savings surpass $2,000. By month 36, cumulative savings relative to continuing API-only trajectory reach $65,000. That's the kind of ROI that justifies the engineering effort upfront.
Month-to-Payback Calculator
The calculation itself is straightforward. Step 1: Audit your trailing 12-month API bill and divide by 12 to get average monthly spend. Step 2: Estimate token throughput by multiplying monthly API requests by average tokens per request, then match to a hardware tier using VRAM tier requirements. Step 3: Calculate payback as (hardware CapEx) ÷ (monthly API spend − monthly operational cost), result in months. Step 4: Match payback window to your roadmap (12-month, 36-month, indefinite) to gauge risk tolerance.
Detailed Calculation Example
Say your API spend is $1,800/month and you process 3M tokens/month across chatbot and RAG endpoints. You pick Tier 2 hardware at $2,000 with monthly ops cost of $110. Monthly savings work out to $1,800 − $110 = $1,690. Payback is $2,000 ÷ $1,690 = 1.18 months.
Wait—that's actually faster than Tier 3 on an absolute basis, though lower absolute savings. Payback compresses, but if the math holds, you hit cash-flow positive nearly immediately. Watch: does Tier 2 handle your token volume? If not, you overprovision and waste capital.
Risk Adjustments & Conservative Estimates
Add a 20% buffer for unexpected maintenance or model-swap retraining cycles. Use 18-month payback as a safe minimum threshold. Forecast API spend dropping >10% yearly? Payback stretches past 24 months and migration barely breaks even. If token throughput grows >30% yearly, payback accelerates and hardware ROI jumps proportionally.
Assume 36-month hardware amortization even if your gear lasts 5+ years. Conservative accounting protects you against obsolescence risk and keeps the decision-making transparent.
Real-World Scenarios: When Migration Wins
Scenario A (RAG chatbot, 2M tokens/month): $3,500/month API spend, Tier 2 payback at month 18. Migrate. Scenario B (low-traffic classifier, 200K tokens/month): $400/month API spend, Tier 1 payback at month 38. Stay on API. Scenario C (code autocomplete, 5M tokens/month): $5,000/month API spend, Tier 3 payback at month 12. Migrate immediately. Scenario D (agentic system, 10M tokens/month): $8,000/month API spend, dual Tier 3 payback at month 6. Migrate with priority. These scenarios come from real hardware specs and token math, not theory.
Green-Light Signals: When to Pull the Migration Trigger
API spend of $2,000+/month sustained for 12+ months indicates payback certainty and team commitment to inference. Over 2M tokens/month? Deploy capital and engineering for local ops. You need latency (chatbot, autocomplete) or compliance control—avoid vendor audits and keep data on-prem.
Your team has 1–2 ops/ML engineers available for 4 hours/month maintenance. The outsourcing support versus DIY payoff is clear and weighted in your favor. When all four are true, migration is a business decision, not a technology one.
Red-Light Scenarios: Stay on API
API spend under $1,000/month means Tier 1 payback exceeds 36 months and capital sits idle. Your use case is experimental or POC; token throughput is volatile or unknown. Fewer than one engineer on ops means hiring or outsourcing local maintenance tanks ROI.
Inference latency requirement is under 100 milliseconds p99. Edge deployment complexity and compliance burden rise sharply. Let the vendor eat the risk and ops cost. That trade-off still favors API.
Hidden Costs of Local vs. API
Personnel cost for one engineer at 4 hours per month to manage OS patches, driver updates, and model retraining comes to $2,400/year—often underestimated in migration pitch decks. Time optimizing inference (vLLM, TensorRT-LLM) is time not building product.
Learning curve is real. Quantization tuning (Q4 vs Q6), batching, multi-card orchestration—40–80 engineering hours upfront. RTX 40-series amortizes over 4–5 years, but cards 18+ months old lose support and driver compatibility.
Operational Overhead Reality Check
VRAM management on 70B+ models requires quantization format tuning (Q4 versus Q5 versus Q6 testing), consuming 20 hours one-time per model family. Batching optimization: most teams overbuild latency tolerance. Realizing 4–8× tok/s speedup requires batching config tuning, an 8–12 hour effort.
Orchestrate dual GPUs with systemd watchdog, K8s, or custom failover—16–40 hours setup. Switching models mid-year (quantization or base) means re-benchmarking and re-validating prompts—12–24 hours per swap.
API's Operational Advantage
Scale without hardware purchase. Bump API capacity in minutes with a rate-limit hike or billing upgrade—not weeks. The vendor manages hardware refresh, driver updates, model scaling, and footprint optimization. OpEx burden shifts away from you.
Fallback is built-in. Local inference crashes? Cascade to API with zero code changes. The vendor owns compliance: SOC 2, HIPAA, data residency, access logs—must-haves for enterprise deals.
For smaller teams, that operational shift is worth the per-token premium. Do the math with your engineering cost included, not just raw API dollars.