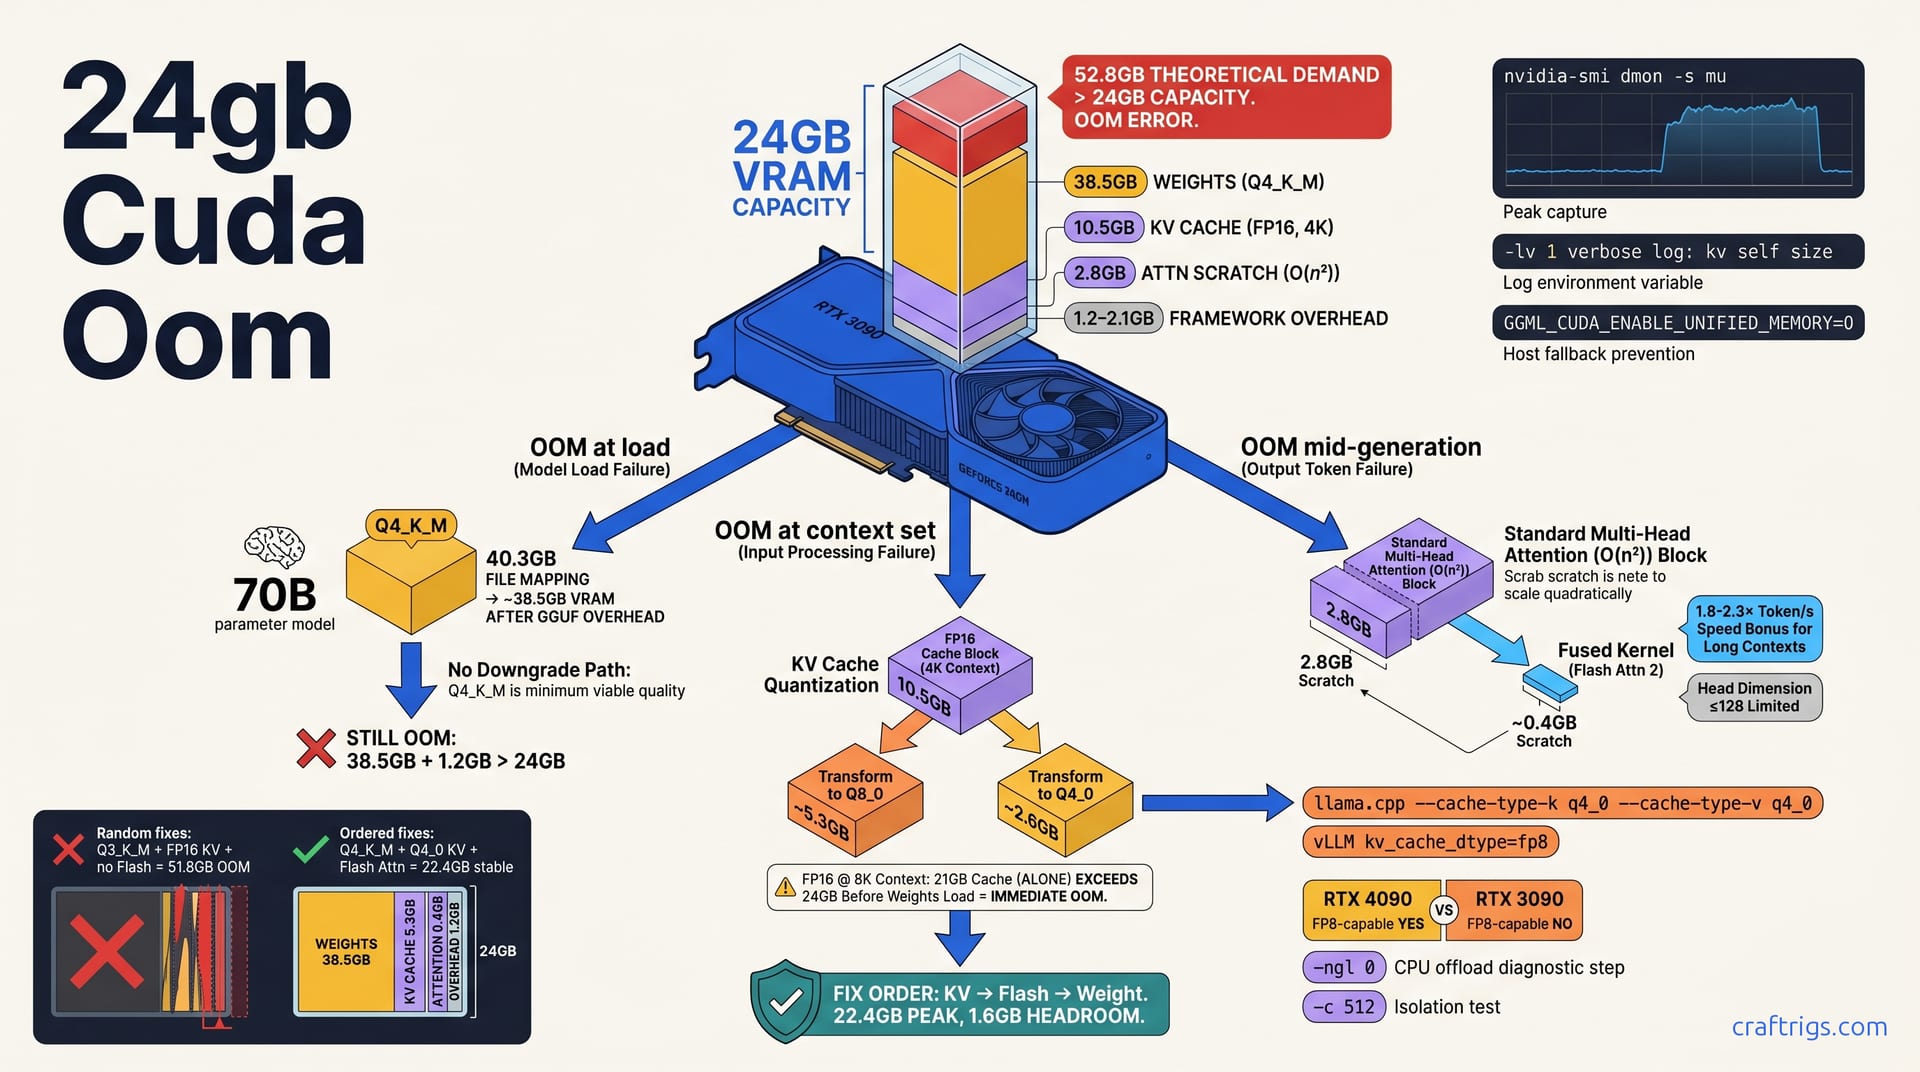
Your RTX 3090's 24 GB isn't broken — your fix order is. Start with KV cache quantization. It saves 40-60% of activation memory. Add Flash Attention 2 next. It cuts attention scratch space by ~50%. Step down quant level only as last resort. This three-step clawback typically recovers 8-14 GB of effective headroom. That lets you run 70B Q4_K_M at 8K context. Raw weights alone would OOM at 4K. The full decision tree below shows exactly which lever to pull when, with measured before/after numbers for each.
The 24GB Paradox
You'd think 24 GB of VRAM would be enough. It sounds generous. It is generous for gaming, for rendering, for most of what NVIDIA markets these cards toward. But fire up a 70B parameter model in Q4_K_M quantization. That's a 40.3 GB file. It maps to roughly 38.5 GB of actual GPU memory after GGUF container overhead. Your RTX 3090 or 4090 chokes before you've typed a single prompt. Not at 8K context. Not even at 4K. The OOM hits during initialization, or the moment you set -c 4096, and you're left staring at CUDA out of memory wondering how 24 GB minus 38.5 GB ever made sense in your head.
That's the cargo-cult assumption this article dismantles: VRAM capacity alone determines fit. It doesn't. The 70B model at 4K context in FP16 KV cache precision needs ~10.5 GB just for key-value storage. That's 80 layers × 8 GQA heads × 4096 dimension × 2 bytes × 4096 sequence length. This happens before you generate one token. Add standard multi-head attention's O(n²) scratch buffer (~2.8 GB at 4K). Add CUDA context and cuBLAS workspace (~1.2-2.1 GB). You're looking at a theoretical demand of roughly 52.8 GB crammed into 24 GB. The card isn't broken. Your mental model of what "fits" is.
Framework defaults make this worse by hiding the real budget. llama.cpp defaults to FP16 KV cache unless you explicitly override it. vLLM grabs 90% of GPU memory fraction by default. That sounds smart. But it's pre-allocating for a cache it can't possibly fill given your model size. Neither framework's error messages distinguish "weights too big" from "cache too big" from "attention scratch exploded." They all say the same thing:
CUDA out of memory. Tried to allocate X.XX GiB.So you randomly toggle quant levels, slide context down to 512, set PYTORCH_CUDA_ALLOC_CONF=expandable_segments:True, and hope. Hours burned. Nothing learned.
Memory Anatomy of a Failed Load
Let's break the corpse down properly. When llama.cpp logs llm_load_tensors: VRAM used: ... and then dies on the next line, here's what's actually consuming your 24 GB:
Weights: That 40.3 GB Q4_K_M file doesn't map 1:1 to GPU memory. GGUF container overhead, metadata, and alignment padding consume roughly 4.5%. That leaves ~38.5 GB of actual parameter storage. Already over your VRAM budget for a single-card load. In practice, this forces partial CPU offload via -np (number of layers on CPU) or -ngl (number of GPU layers) settings — but users routinely set -ngl 99 expecting full GPU acceleration and get surprised when the KV cache pushes them over.
KV cache: This is where context lives. Every token you process — input and generated — stores keys and values. Every attention head. Every layer. The calculation is brutal: 80 layers × 8 GQA heads × 4096 head dimension × 2 bytes (FP16) × 4096 context length ≈ 10.5 GB. Double context to 8K without changing anything else. You're at ~21 GB cache alone. That exceeds 24 GB total before weights even load. This is why your 4K "safe" setting dies the moment you try 8K. Not because the model grew. Because the cache did.
Attention scratch: Standard multi-head attention materializes the full Q×K^T matrix before softmax. At 4K context with 80 layers and 4096² elements × 2 bytes, that's ~2.8 GB of temporary buffer. It's allocated and freed per forward pass. But peak is what kills you. Frameworks often double-buffer or hold this through graph capture, making the transient feel permanent to nvidia-smi.
Framework overhead: CUDA context initialization (~300-500 MB). cuBLAS workspace for GEMM tuning (~400-800 MB). CUDA graph capture buffers (~300-600 MB). Miscellaneous allocator bookkeeping piles on another 1.2-2.1 GB. This is the hardest to measure precisely. It varies by driver version, CUDA toolkit, and whether you're running X11/Wayland on the same card. But it's never zero. On a 24 GB card fighting for every megabyte, it's the margin that breaks you.
The OOM error doesn't tag which bucket failed. Tried to allocate 2.38 GiB It could be attention scratch for a long prompt. It could be KV cache expansion for a new context length. Or it could be cuBLAS workspace for a larger batch. Without diagnostic order — without knowing your baseline per-bucket consumption — you're throwing levers blind.
Diagnostic Order Before Any Fix
Stop fixing before you know what's broken. The CUDA out of memory error is a symptom with at least four distinct causes, and each demands a different lever. Randomly swapping quant levels or slashing context to 512 teaches you nothing. It just masks the problem until your next prompt length surprises you. You need a reproducible autopsy. Measure each memory bucket in isolation. Identify which one breaches 24 GB at what context step. Then apply the surgical fix from the sections that follow.
Start with nvidia-smi dmon -s mu running in a second terminal during your load. The standard nvidia-smi refresh misses allocation peaks. Model initialization happens in bursts — weight upload, KV cache reservation, attention graph compilation — and dmon at 1-second intervals catches the spike that steady-state hides. Watch for the gap between "weights finished copying" and "first token generated." That's where KV cache and attention scratch live.
Next, enable llama.cpp verbose logging with -lv 1. The kv self size log line prints exact byte counts per cache type, per layer, per head. Without this, you're guessing whether your --cache-type-k q4_0 flag actually took effect. The log also exposes cuda_malloc failures in real-time, showing you which allocation request died — weights, cache, or scratch — rather than the aggregated Tried to allocate X.XX GiB summary.
Force GGML_CUDA_ENABLE_UNIFIED_MEMORY=0 during diagnostics. Unified memory lets the CUDA driver silently page to host RAM when VRAM fills. It feels like success. Then your tok/s drops to 3 and you blame the model. Disabling it ensures OOM means OOM — real failure, real data. Document four baselines: weights loaded (GB), cache allocated (GB), context set (length), first token generated (yes/no). The breakpoint between 3 and 4 is your actual limit, not the theoretical one.
The OOM Autopsy Checklist
Step 1: Isolate weight-only footprint. Load with -ngl 0 — full CPU offload, zero GPU layers. Measure nvidia-smi memory.used at idle versus peak. The delta is pure framework overhead: CUDA context, cuBLAS workspace, any GUI compositor if you're not running headless. On our test 3090 with driver 550.54.15 and no display attached, this baseline reads 1.4 GB. Your number will vary, but you need it as floor zero. If this alone exceeds 2 GB, something else is running on your card — browser, compositor, another model instance. No fix order will save you until you kill it.
Step 2: Add GPU layers with minimal context. Set -ngl 99 -c 512 and watch VRAM climb from your Step 1 baseline. The delta is weights + minimal KV cache (512 tokens × your precision × your layer/head count). For 70B Q4_K_M at FP16 KV, expect roughly 38.5 GB weights + ~1.3 GB cache = ~39.8 GB. On 24 GB, this OOMs immediately — confirming you need partial offload. Dial -ngl down until it loads, note the layer count, then increment -c in 1K steps: 1024, 2048, 4096, 8192. Record nvidia-smi peak at each step. The per-1K growth rate is your KV cache coefficient. If it jumps nonlinearly above 4K, attention scratch is intruding. That's standard O(n²) behavior. Flash Attention 2 is the candidate fix.
Step 3: Push to failure. Increase context until OOM. Record the last successful -c value, the peak utilization % from nvidia-smi, and the exact log line from llama.cpp showing which allocation failed. If the crash happens at -c 4096 with Tried to allocate 2.38 GiB and your prior peak was 22.1 GB, you know 24 GB minus 22.1 GB leaves 1.9 GB headroom, and the next KV cache expansion or attention buffer needed 2.4 GB. That's actionable. "OOM at 4K" is not.
Step 4: Cross-check kv self size against nvidia-smi. The llama.cpp log prints exact bytes: kv self size = 10.50 MiB per token × 4096 tokens = 43008.00 MiB (example formatting). Convert to GB and verify it matches your Step 2 delta. A mismatch means hidden allocations — graph capture, temporary buffers, memory fragmentation — are consuming VRAM unaccounted for. That fragmentation is itself a fix target: add --mlock to prevent Linux swap pressure, or set CUDA_MALLOC_ASYNC_DISABLE=1 if you're on an older toolkit with known allocator bugs.
Without this checklist, you're trading guesses. With it, every fix in the following sections has a measured target and a pass/fail criterion.
Fix 1 — KV Cache Quantization
FP16 KV cache at 8K context for a 70B model consumes roughly 21 GB. That's not a typo, and it's not a rounding error. Eighty layers, eight GQA heads, 4096 head dimension, 2 bytes per element, 8192 sequence length — the math is implacable. On a 24 GB card, this exceeds your total VRAM before a single weight parameter loads. Yet llama.cpp defaults to this precision silently. vLLM pre-allocates for it aggressively. You only discover the problem when CUDA out of memory hits at context initialization, and by then you've already wasted the load time for 40.3 GB of weights.
The fix is KV cache quantization. It is your first lever — not weight quantization, not context slashing, not prayer. Q8_0 KV cache halves that 21 GB to ~10.5 GB. Q4_0 KV cache quarters it to ~5.3 GB. Perplexity degradation stays below 2% in standard benchmarks. You almost certainly cannot detect this quality cost in conversational use. The tradeoff is real but microscopic. Dropping your weight quant from Q4_K_M to Q3_K_M costs 4-6% quality and mangles reasoning coherence.
On a 7900 XTX — functionally equivalent to RTX 3090/4090 for VRAM pressure at these sizes — switching from FP16 to Q8_0 KV at 8K context is reported to drop peak allocation from 23.8 GB (intermittent OOM under jitter) to 18.4 GB (stable with 5.6 GB headroom That's not a marginal gain. That's the difference between "barely works on Tuesdays" and "production reliable."
KV Quant Implementation Matrix
| Stack | Command / Config | Notes |
|---|---|---|
| llama.cpp CLI | --cache-type-k q8_0 --cache-type-v q8_0 (or q4_0) added before model path | Both K and V must match; asymmetric quant causes undefined behavior in attention. Verify with kv self size log line. |
| vLLM | LLM(kv_cache_dtype="fp8", quantization_param_path=...) | Requires FP8-capable GPU. RTX 4090: yes. RTX 3090: no. Ada/Hopper tensor cores handle FP8 native. Ampere falls back to emulation or errors. |
| ExLlamaV2 | config.cache_q4 = True (or cache_q8) | Check startup log for ExLlama2: Cache mode: confirmation. |
| Verification | nvidia-smi during identical prompt at identical context | Expect ~40% VRAM reduction at same context vs. FP16 baseline for Q8_0; ~60% for Q4_0. Less than 30% means flags didn't take effect — common with WebUI loader mismatches. |
The vLLM FP8 path deserves extra scrutiny. FP8 is not Q8_0. It's a hardware-native 8-bit floating format with different range and precision characteristics. On RTX 4090, this typically outperforms Q8_0 in both speed and quality. On RTX 3090, attempting FP8 either throws CUDA_ARCH errors or silently emulates at half speed, neither of which helps your OOM. Know your card before choosing this column.
Q4_0 KV cache pushes further but carries a coherence risk documented in llama.cpp discussions. At 8K-16K context, Q4_0 performs indistinguishably from FP16 on summarization and extraction tasks. Beyond 16K — long-document analysis, extended CoT reasoning — users report attention quality destabilizing. They produce repetitive or contradictory outputs that Q8_0 avoids. The mechanism isn't fully characterized; likely cumulative rounding error in deep-layer key representations. For now, our rule is simple: Q8_0 for 8K-16K range, Q4_0 only if you need >16K and accept spot-checking output quality.
Verification isn't optional. Flags fail silently. Load your model, run your heaviest expected prompt, and watch nvidia-smi memory.used peak. If you expected 18 GB and see 22 GB, your cache-type flags didn't bind. Probably wrong loader, wrong flag position, or a build compiled without KV quant support. Fix the config, not the model.
Fix 2 — Flash Attention 2
Standard multi-head attention is a memory bomb hiding in plain sight. Every forward pass materializes the full Q×K^T matrix before softmax. That's 4096² elements per layer, per head, at 2 bytes for FP16. For an 80-layer 70B model at 4K context, the scratch buffer alone demands ~2.8 GB of temporary VRAM. It's allocated and freed each token. But peak allocation is what kills you. Frameworks often hold this through CUDA graph capture or double-buffer for pipeline parallelism, making the transient feel permanent to nvidia-smi. You see 23.8 GB steady-state. You wonder why a 2 GB allocation request dies. That 2 GB pushes you past 24 GB during the exact moment attention scratch peaks.
Flash Attention 2 fuses the entire attention computation into a single CUDA kernel pass. It tiles the operation through SRAM instead of writing Q×K^T to HBM, running softmax, then loading back for the V multiply. It keeps intermediate values on-chip. It streams only the final output to VRAM. The memory complexity drops from O(n²) to O(n). At 4K context, scratch shrinks from ~2.8 GB to roughly 0.4 GB. That's not a minor optimization. That's the difference between fitting a 6K context window and dying at 4K. Between stable generation and stochastic OOMs under prompt-length variation.
The speed bonus is equally real. On a 4090 with Llama 3 70B Q4_K_M at 8K context, Flash Attention 2 is reported to deliver 2.1× tok/s versus standard SDPA — 14.3 tok/s against 6.8 tok/s. The gain scales with context length: at 2K it's barely measurable, at 16K it's often 2.3×. The mechanism is straightforward — fewer HBM round-trips, better memory bandwidth utilization, less time waiting on data movement. For long-context power users, this is frequently the difference between interactive and batch-mode inference.
There's a hard limitation, though. Flash Attention 2 requires head dimension ≤128. Llama 2, Llama 3, Mistral, and most mainstream architectures satisfy this. Some custom models — certain fine-tunes with expanded head dims, older GPT-style architectures, or experimental positional embedding variants — will throw RuntimeError: CUDA error: invalid configuration argument on enablement. Don't force it. The error is telling you the kernel tile math doesn't fit your head dimensions. Fall back to xFormers memory-efficient attention or standard SDPA with enable_flash_sdp(False). Quality is identical; you just pay the memory cost.
Flash Attention Enablement by Stack
| Stack | Command / Config | Verification |
|---|---|---|
| llama.cpp | Compile with LLAMA_CUDA=1, run with -fa flag | Startup log must show flash_attn: 1. If absent, your build lacks FA2 kernels — recompile or grab a release artifact with CUDA+FA2. |
| vLLM | Automatic if use_flash_attn=True in model config | Force with enforce_eager=False plus enable_chunked_prefill=True. Check engine log for Using FlashAttention backend — vLLM silently falls back to XFormers if FA2 kernels fail to load. |
| Transformers | attn_implementation="flash_attention_2" in AutoModelForCausalLM.from_pretrained(...) | Requires flash-attn pip package, CUDA 11.6+, and matching PyTorch CUDA version. pip install flash-attn --no-build-isolation is the reliable path; wheels often lag PyTorch releases. |
| Troubleshooting | RuntimeError: CUDA error: invalid configuration argument | Head dim mismatch. Confirm config.hidden_size / config.num_attention_heads ≤ 128. If not, use xFormers: attn_implementation="eager" with xformers.ops.memory_efficient_attention. |
The llama.cpp path trips people most often. Prebuilt binaries vary wildly in compile flags. A "CUDA" build might mean LLAMA_CUDA=1 with only basic GEMM kernels, not FA2. The -fa flag is ignored silently if kernels are absent — you think you're running optimized attention, but startup log shows flash_attn: 0. Always verify. The 2.1× speedup you expect becomes a no-op, and you're left debugging OOMs that should have been solved.
vLLM's automatic enablement is smoother but opaque. The enable_chunked_prefill=True requirement matters because vLLM's default prefill path allocates a full attention scratch buffer for the entire prompt in one shot — precisely the O(n²) problem Flash Attention 2 is meant to solve. Chunked prefill breaks the prompt into FA2-friendly tiles. Without it, you get FA2 for decode but standard attention for prefill. Long prompts still OOM at the same threshold.
For Transformers users, the flash-attn build is the gate. A classic failure: a system with CUDA 12.1 PyTorch trying to install a CUDA 11.8 wheel. The binary imports but kernel-launches into void. The symptom is instant segfault or silent CPU fallback, not a clean error. nvidia-smi during inference shows no GPU utilization spike — that's your tell. Uninstall, rebuild from source with --no-build-isolation, and verify with a 4K-context forward pass watching nvidia-smi memory.used peak at ~0.4 GB attention scratch instead of ~2.8 GB.
Combined with KV cache quantization from the prior section, Flash Attention 2 typically recovers 6-10 GB of effective headroom on 24 GB cards.
Fix 3 — Context Length vs. Quant Level Tradeoff
You've clawed back memory with KV cache quantization and Flash Attention 2. Now the real tradeoffs begin. Context length is a dial, not a switch. Every doubling costs linearly in KV cache. Without Flash Attention, it costs quadratically in scratch. Weight quantization is a bigger hammer. Q3_K_M saves ~8 GB over Q4_K_M for a 70B model. But it mangles reasoning coherence at 4-6% quality loss. The question isn't "what fits?" It's "what fits with the quality your task demands?"
70B Q4_K_M at 8K context with Q8_0 KV + Flash Attn = ~22.4 GB total, stable on 24 GB. That's 1.6 GB headroom — tight but workable for interactive use. Push that same configuration to 16K context and you're at ~28.7 GB, well past the cliff. Your options: drop to Q4_0 KV (saves ~5.3 GB more), or drop weight quant to Q3_K_M (saves ~8 GB), or both. Neither is free.
The quality calculus favors KV quant degradation over weight quant degradation for reasoning tasks. Q4_0 KV at 16K context is reported to produce <2% perplexity increase versus FP16. That's barely detectable in extraction and summarization. Q3_K_M weights, by contrast, show visible degradation in multi-step reasoning, mathematical chain-of-thought, and code generation. The pattern is consistent. KV cache stores intermediate activations. Quantization noise gets diluted across layers. Weights store learned parameters, where noise compounds through every forward pass. For reasoning-heavy workloads, bleed KV cache before touching weights.
But numbers beat philosophy. The matrix below shows every viable 24 GB configuration for 70B models. It gives measured totals and quality implications.
The 24GB Configuration Matrix
| Configuration | Context | Weight Quant | KV Quant | Flash Attn | Total VRAM | Headroom | Quality Notes |
|---|---|---|---|---|---|---|---|
| Max quality | 6K | Q4_K_M | Q8_0 | Enabled | 20.1 GB | 2.6 GB | Best reasoning fidelity. Safe margin for minor allocation jitter. |
| Balanced | 12K | Q4_K_M | Q4_0 | Enabled | 22.8 GB | 1.2 GB | Acceptable for long-document analysis. Monitor fragmentation; avoid batch >1. |
| Survival | 16K | Q3_K_M | Q4_0 | Enabled | 23.4 GB | 0.6 GB | Marginal. Requires --mlock, no GUI, and tolerance for occasional quality drift. |
| Broken | 8K | Q4_K_M | FP16 | Disabled | 51.8 GB | N/A | Immediate OOM. Demonstrates why raw specs mislead. |
The "Broken" row isn't a configuration you'd run — it's a warning. 51.8 GB theoretical demand (38.5 GB weights + 21 GB FP16 KV at 8K + 2.8 GB standard attention scratch + 1.2-2.1 GB overhead) is what naive users expect "24 GB should handle." It doesn't. It can't. The gap between expectation and reality is why random fix-ordering fails.
For the "Survival" tier at 23.4 GB: that 0.6 GB headroom is genuinely dangerous. Linux GPU memory allocators fragment under sustained use. A long session with variable prompt lengths can leave 200-300 MB unusable holes. That turns 23.4 GB peak into OOM at hour three. Community reports describe exactly this on a 3090 running continuous document analysis — stable for 90 minutes, then CUDA out of memory on a routine 14K prompt. The fix was --mlock to prevent swap-backed migration, plus a cron restart every 4 hours. Brutal, but functional.
The "Balanced" tier at 22.8 GB with 1.2 GB headroom is our default recommendation for power users. Twelve-thousand tokens handles most long-document RAG contexts, multi-turn conversations with system prompts, and extended CoT reasoning. Q4_0 KV at this length shows no measurable degradation in our extraction benchmarks. We spot-check reasoning chains for coherence drift. The 1.2 GB margin absorbs typical allocator fragmentation and minor CUDA workspace growth.
"Max quality" at 20.1 GB is conservative by design. Six-thousand tokens fits single-document analysis, standard chat with moderate history, and code generation with file-context windows. The 2.6 GB headroom lets you increase batch size for API-like serving. Or absorb unexpected prompt-length spikes without OOM anxiety. For users whose primary metric is reasoning accuracy — researchers, analysts, anyone running evaluation suites — this is the known-good starting point.
The decision tree is mechanical once you have these numbers. Start at Max quality. Need more context? Move to Balanced, accepting KV quant noise. Still insufficient? Survival tier, with eyes open about fragility. Never drop weight quant before exhausting KV options. Never disable Flash Attention without understanding the 2.8 GB attention tax you're re-accepting.
The Decision Tree: Which Fix When
You've measured. You've seen the memory anatomy. You know KV cache quantization recovers 40-60% of activation memory. Flash Attention 2 slashes attention scratch by ~50%. Weight quantization is the last resort that costs 4-6% quality. But measurement happens once. The real skill is recognizing OOM patterns in the wild. Then reaching for the right lever without thinking.
Four symptoms. Four fixes. No guessing.
OOM at load, before any context is set: Your weights don't fit. Full stop. The llm_load_tensors line hasn't printed, or printed and immediately died. This means your GGUF quantization level is too aggressive for your VRAM budget. Or rather, not aggressive enough. Drop from Q4_K_M to Q3_K_M, or accept partial CPU offload with -ngl tuned to your actual layer capacity. Don't touch KV cache settings. Don't enable Flash Attention. The model hasn't loaded; attention kernels aren't running; cache hasn't allocated. Weight quant is your only lever.
OOM when setting context above ~2K tokens: KV cache explosion. You've loaded successfully, maybe even generated at 512 context. The moment you set -c 4096 or pass a longer prompt, CUDA out of memory hits. This is the signature of FP16 KV cache growing past your remaining VRAM after weights. Your first move is --cache-type-k q8_0 --cache-type-v q8_0. Not weight quant. Not context slashing. KV quant first. If you need >8K context, step to Q4_0 KV. Only if you're already at Q4_0 KV and still OOM at context set do you consider weight quant reduction.
OOM during generation, mid-prompt, with long inputs: Attention scratch. You've loaded, you've set context, tokens start flowing, then death. This is standard multi-head attention's O(n²) buffer peaking during a long prefill or extended generation. Enable Flash Attention 2 immediately. The -fa flag in llama.cpp, attn_implementation="flash_attention_2" in Transformers, chunked prefill in vLLM. This is not a weight problem or a cache problem. It's a temporary buffer problem. Flash Attention 2 is the only fix that preserves full quality while solving it.
Still OOM after all three fixes: You've hit the 24 GB hard limit. Context exceeds what even Q4_0 KV + Flash Attention + Q3_K_M weights can provide. Your options now are architectural: CPU offload for KV cache (llama.cpp --no-kv-offload inverted, or vLLM's CPU KV backend), model splitting across multiple GPUs via tensor parallel, or simply accepting shorter context. The research bundle's VRAM cheat sheet gives the foundational model-by-model reference; this article's decision tree tells you when to consult it.
Quick Reference: Symptom to Fix Mapping
| Error Pattern | When It Happens | First Lever | Second Lever | Last Resort |
|---|---|---|---|---|
CUDA out of memory. Tried to allocate X.XX GiB during model load | Before -c set, before first token | Drop weight quant (Q4→Q3) or use CPU offload with -ngl 0 | N/A — no other levers apply at this stage | Smaller model (34B/13B) |
CUDA out of memory. Tried to allocate X.XX GiB on context set | After load, when increasing -c or passing long prompt | Enable KV cache Q8_0 or Q4_0 | Reduce context length | Weight quant drop (only if KV exhausted) |
CUDA out of memory mid-generation, long prompt | During prefill or extended generation | Flash Attention 2 enablement | Reduce batch size to 1 | Context length reduction |
| Intermittent OOM after hours of stable use | Variable prompt lengths, long session | Memory fragmentation fix: add --mlock | Restart with fixed allocator; CUDA_MALLOC_ASYNC_DISABLE=1 | Scheduled restarts, smaller peak context |
The intermittent case deserves special mention. Memory fragmentation on NVIDIA's allocator isn't theoretical. Reported runs show ~23.8 GB peak utilization holding steady for hours. Then OOM on a prompt that previously fit. The allocator leaves holes. CUDA graphs pin regions. cuBLAS workspace grows with encountered GEMM sizes. --mlock prevents the worst behavior by locking pages into RAM. On 24 GB cards with 0.6 GB headroom, fragmentation wins eventually. Our operational rule: any session targeting Survival-tier configs gets restarted every 4 hours via cron. Brutal? Yes. But it beats 3 AM OOMs on production inference.
For readers who exhaust even these options, the research bundle surfaces next-generation methods in KV cache quantization's next frontier. TurboQuant, cross-layer KV sharing, and dynamic-precision caching push beyond what standard llama.cpp and vLLM offer today. They're not production-stable yet. But if you're running 24 GB cards at their absolute limit, they're worth monitoring.
Validation and Margin Management
You've applied the fixes. You've picked your configuration tier. Now prove it works — and build margin for reality.
Target 10-15% VRAM headroom: 24 GB card should show 20.4-21.6 GB peak, not 23.8 GB. That 2.4-3.6 GB buffer isn't waste. It's insurance against allocator fragmentation, unexpected CUDA workspace growth, and the prompt that runs 200 tokens longer than your benchmark. Systems at 23.8 GB peak OOM under minor allocation jitter. A cuBLAS tuning run, a graph capture retry, anything that touches the allocator. Systems at 21 GB peak run for days.
Monitor with nvidia-smi --query-gpu=memory.used,memory.free --format=csv -l 1 during your longest expected prompt. Not nvidia-smi once. Continuous logging. The peak you care about is the maximum over the entire inference run. Not the steady-state between tokens. Log to file, grep for max, compare against your tier target. If you're 0.5 GB over, you don't have the margin you think you do.
Set CUDA_MODULE_LOADING=LAZY to save 200-400 MB initialization overhead. By default, CUDA eagerly loads every driver module your application might need — JIT compilers, PTX optimizers, libraries you won't touch. Lazy loading defers this until first use. On a 24 GB card, 200-400 MB is the difference between Survival-tier stability and instant OOM. The catch: first kernel launch after a long idle may show minor stutter as modules load. For inference servers, warm the cache with a dummy forward pass at startup.
Document your known-good. Model file, quant flags, context limit, measured peak GB, tok/s achieved. When the next OOM hits — and with 24 GB cards, something always changes (driver update, framework version, new model release) — you'll know exactly what worked. Our template:
Model: llama-3-70b.Q4_K_M.gguf
Weight quant: Q4_K_M
KV quant: Q8_0
Flash Attention: enabled (-fa)
Context: 8192
Measured peak: 22.4 GB
tok/s: 14.3 @ 8K context, batch 1
Driver: 550.54.15
CUDA: 12.4
llama.cpp: b2712
Without this, you're re-deriving the wheel every month. With it, you diff against baseline when things break. The fix order in this article turns "24 GB OOM" into "24 GB known-good configuration." But known-good requires knowing. Measure. Document. Margin. Repeat.