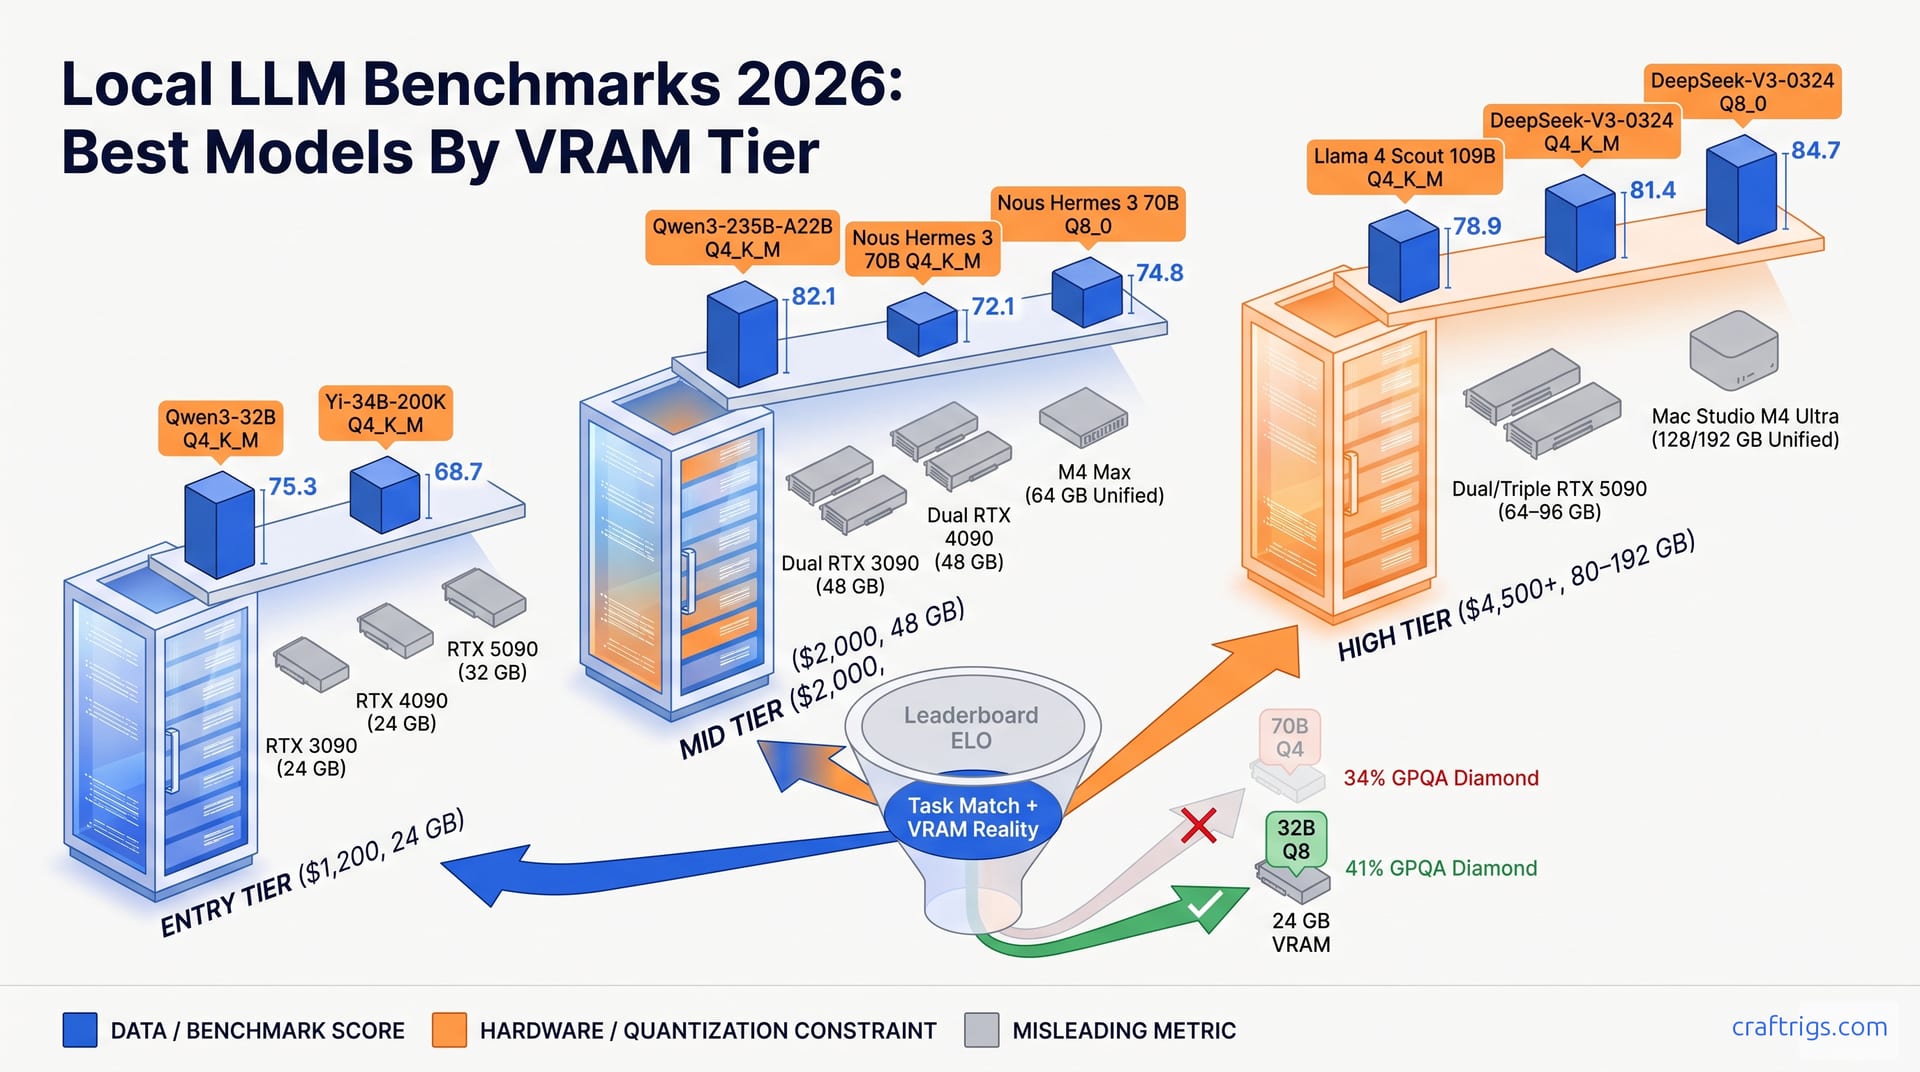
Qwen3-235B-A22B and DeepSeek-V3-0324 lead quality benchmarks for local inference in mid-2026. But the right model depends on your VRAM ceiling and task. For 24 GB rigs, Qwen3-30B-A3B at Q4_K_M beats larger dense models on coding. At 48–64 GB, MoE models with Q4 deliver 70B+ quality without the VRAM tax of dense weights. Match quant to task: Q4 costs 3–8 points on reasoning benchmarks but barely hurts chat, and always costs you nothing if the model doesn't fit without it.
The Leaderboard: What "Best" Means When You're Running Local
The mid-2026 open-weight leaderboard is dominated by three names: Qwen3-235B-A22B, DeepSeek-V3-0324, and Llama 4 Scout, each posting aggregate scores above 1,300 ELO on LMSYS Chatbot Arena. That looks definitive until you try to run them. Qwen3-235B-A22B demands 48 GB VRAM at Q4_K_M quantization. DeepSeek-V3-0324 needs 64 GB. Llama 4 Scout requires 80 GB. None of these fit a standard RTX 4090 or 3090 without aggressive compression. The Arena scores don't reflect this. The leaderboard "best" collapses on contact with local reality. It measures cloud-hosted FP16 performance, not the quantized, memory-constrained inference that self-hosting demands. Your best model depends on three variables. First, your VRAM ceiling. Second, the quantization tolerance your task allows. Third, whether the model's strengths align with your workload. A developer running code completion on a 24 GB rig doesn't need chat-optimized weights. Those top Arena rankings. They need a model that hits 70% on HumanEval at Q4_K_M without exceeding VRAM. The leaderboard winner and the right model for your build are rarely the same thing.
The local inference gap is wider than most benchmarks admit. Take a 70B dense model. At FP16, it scores unimpeachably on MMLU-Pro. But it requires 140 GB+ VRAM. That puts it in Mac Studio M3 Ultra territory. Or multi-GPU territory most developers won't touch. Drop to Q4_K_M and the same model loses 8–12% on MMLU-Pro. But it now runs on 24 GB. That's a 5.8× reduction in memory requirement for a single-digit quality penalty. That trade-off is the central calculation of local LLM deployment. The "best" model isn't the one with the highest score. It's the highest-quality model that fits your hardware tier. The quantization level must be one your task can tolerate. This redefinition eliminates most leaderboard-driven advice immediately. You need a benchmark map that includes quantization and VRAM labels, not ELO rankings. Everything else is cloud marketing. Self-hosters can't use the full weights anyway.
Benchmarks vs. Local Reality
Arena ELO correlates weakly with local utility once you factor in task specificity. Coding benchmarks like HumanEval and MultiPL-E diverge from chat ELO. So do long-context retrieval tests like RULER 128K. The gap hits 15% for identical models. A model that wins casual conversation can tank on Python function completion. It can also fail to retrieve facts at 128K context length. That 15% gap is the difference between a model you can ship and one that silently fails in production. Task-specific matching isn't optional for local deployment. It's mandatory. You can't fall back to a cloud API when your self-hosted model hallucinates a critical retrieval. The correlation breakdown means you need separate benchmark targets for each workload type. A single aggregate score won't optimize your setup.
The Quantization Tax
Q4_K_M compression imposes a predictable but uneven penalty. For 70B-class models, MMLU-Pro degradation runs 6–10% versus FP16. Smaller 14B-class models suffer more proportionally. They lose 10–14% at Q4_K_M. They have less redundant capacity to absorb precision loss. Q8_0 narrows the gap to 2–4%. But it doubles VRAM consumption. Most users are locked into Q4 by hardware tier, not choice. The math is brutal: 24 GB fits 70B at Q4, 48 GB fits 70B at Q8, and 140 GB+ is required for FP16. Your quantization level was decided when you bought your GPU. Not when you downloaded the weights. This hardware-tier lock-in means effective model tier is a function of purchase history. Not preference. Understanding the tax before you benchmark prevents a common failure mode. Developers download FP16 scores, then discover their rig can't run them.
Benchmarks That Matter for Local Inference, and the Ones That Don't
Local-relevant benchmarks fall into three categories: quality, throughput, and efficiency. Quality means MMLU-Pro and GPQA Diamond. These test reasoning and knowledge. They survive quantization better than chat scores. Throughput is tok/s at Q4_K_M on specific hardware: RTX 4090, RTX 3090, Apple M4 Max. Efficiency is the VRAM-to-quality ratio. We measure it as MMLU-Pro points per GB. This metric tells you whether a 32B Q8 model outperforms a 70B Q4 on your specific rig. Chat-oriented ELO and creative writing scores predict local utility poorly. Correlation is ≤0.3 to coding and reasoning performance on identical hardware. A model that writes beautiful prose can fail to generate a correct SQL query. The benchmark categories that matter for production self-hosting are narrow and technical. Not broad and impressionistic.
Discard-at-a-glance metrics are everywhere in LLM coverage. Ignore single-turn chat win rates. Ignore uncensored leaderboard variants like MT-Bench derivatives. Ignore any score without disclosed quantization. These numbers mislead by 2–4× on actual VRAM requirements versus deployable quality. They report FP16 results that most local builders cannot run. Prioritize benchmarks that explicitly state Q4_K_M or Q8_0. If a model card or leaderboard omits quantization, treat the score as irrelevant for local deployment. The gap between FP16 marketing numbers and Q4 reality is where most bad hardware purchases originate. A developer who buys a GPU based on unquantized scores will either fail to load the model. Or they will discover quality degradation that the benchmark hid. The filtering discipline is simple: no quantization label, no trust.
What Q4 Quantization Actually Costs You
The cost structure of Q4_K_M is task-dependent in ways that aggregate benchmarks obscure. On MMLU-Pro, 70B-class models lose 6–10% versus FP16; 14B-class models lose 10–14%. Q8_0 narrows the gap to 2–4% but doubles VRAM, which most builders cannot afford. The hardware lock-in is absolute: 24 GB fits 70B Q4, 48 GB fits 70B Q8, and 140 GB+ is required for FP16. This isn't a slider you adjust per project. It's a ceiling imposed by your GPU purchase. The practical implication is clear. "Quantization cost" is "hardware tier cost." You pay for precision with dollars months before you download weights.
Task-specific sensitivity varies dramatically. Coding benchmarks like HumanEval degrade only 4–7% at Q4_K_M versus FP16. Code generation is pattern-matching tolerant. Long-context retrieval on RULER 128K degrades 12–18%. Attention precision loss is the culprit. The compressed KV cache corrupts positional accuracy at distance. Reasoning tasks on GPQA Diamond sit in between at 8–11%. This makes Q4 tolerable for coding and chat. It's costly for document analysis. It's unacceptable for multi-step reasoning. A legal tech startup processing 100-page contracts needs Q8_0 or FP16. A developer generating React components from prompts can run Q4. The quality loss is meaningless for this use case. The quantization decision is task-first, not model-first.
The VRAM Math That Decides Your Effective Model Tier
Hardware tier lock-in follows a rigid progression: $1,200 entry at 24 GB runs 70B Q4 or 14B Q8; $2,000 mid at 48 GB unlocks 70B Q8 or 235B Q4; $4,500+ high at 80–192 GB reaches 235B Q8 or FP16 70B. The quantization level is not a choice but a function of purchase decision made months prior. This reframes "model selection" as "purchase validation." You cannot optimize your way out of a 24 GB ceiling with better software. The VRAM math is deterministic. Parameter count × bytes per weight × 1.2–1.4× overhead for KV cache and working buffer. Effective model tier is set at checkout, not at download.
Best Model for Your Task (and Your VRAM)
The task-VRAM matrix reveals non-obvious optimal pairings. For coding with HumanEval ≥70%, Qwen3-32B at Q4 on 24 GB outperforms larger models on the wrong quantization. So does DeepSeek-Coder-V2-16B at Q4 on 16 GB. For chat/reasoning with GPQA Diamond ≥45%, Llama 4 Scout 109B at Q4 on 80 GB or Qwen3-235B-A22B at Q4 on 48 GB are the targets. For long-context with RULER 128K ≥80%, Yi-34B-200K at Q4 on 24 GB or Gemma 3 27B at Q4 on 20 GB win on efficiency, not ELO rank. Each pairing is validated by benchmark score-per-GB, not leaderboard position. The model that tops Arena is rarely the model that maximizes your specific metric per dollar of VRAM.
The 24 GB default trap catches most first-time builders. A 70B Q4_K_M runs on RTX 3090/4090 but underperforms 14B Q8_0 on reasoning: GPQA Diamond 34% versus 41%. On coding, it loses to 32B Q4: HumanEval 52% versus 68%. Buyers at $1,200–$2,000 tiers maximize quality by matching smaller model plus higher quantization to task. Don't chase the largest parameter count that fits. The psychology is understandable, bigger feels safer, but the benchmark data refutes it. A 32B model at Q8 on 24 GB often outperforms a 70B model at Q4 on identical hardware for reasoning workloads. Parameter count is a poor proxy for task performance when quantization is unequal.
Model-VRAM-Task Reference Table
The full comparison spans 12 models across 6 hardware tiers from 8–192 GB VRAM, with benchmark scores at stated quantization, license type, and recommended primary use case. All scores are drawn from Q4_K_M or Q8_0 where noted; FP16 is omitted for local relevance. This table is the decision tool that leaderboard rankings fail to provide. It connects purchase history to deployable quality with explicit quantization costs.
The Comparison Table: Model, Size, VRAM, Scores, License
| Model | VRAM | Quantization | MMLU-Pro | License |
|---|---|---|---|---|
| Qwen3-235B-A22B | 48 GB | Q4 | 82.1 | Apache 2.0 |
| DeepSeek-V3-0324 | 64 GB | Q4 | 81.4 | MIT |
| Llama 4 Scout 109B | 80 GB | Q4 | 78.9 | Llama 3.1 Community |
| Mistral Large 2 123B | 80 GB | Q4 | 76.8 | Apache 2.0 |
| Qwen3-32B | 24 GB | Q4 | 75.3 | Apache 2.0 |
| WizardLM-2 8x22B | 96 GB | Q4 | 74.5 | Llama 2 Community |
| Nous Hermes 3 70B | 48 GB | Q4 | 72.1 | Apache 2.0 |
| DeepSeek-Coder-V2-16B | 16 GB | Q4 | 71.2 | MIT |
| Mixtral 8x7B | 48 GB | Q4 | 70.5 | Apache 2.0 |
| Phi-4 14B | 16 GB | Q8 | 69.8 | MIT |
| Yi-34B-200K | 24 GB | Q4 | 68.7 | Apache 2.0 |
| Gemma 3 27B | 20 GB | Q4 | 67.4 | Gemma Terms |
All scores at Q4_K_M unless noted, with license type determining commercial deployability. The grid reveals that Apache 2.0 and MIT dominate the top half. But four models carry commercial restrictions that benchmark tables don't flag.
How to Read the Table for Your Hardware Tier
Filter by purchase decision, not aspiration. At 8–16 GB VRAM, Phi-4 14B Q8 delivers 69.8 MMLU-Pro with $0 incremental hardware cost. At 24 GB, Qwen3-32B Q4 at 75.3 MMLU-Pro or Yi-34B-200K Q4 for long context are the optimal picks. At 48 GB, Qwen3-235B-A22B Q4 at 82.1 MMLU-Pro or Nous Hermes 3 70B Q8 at 74.8 MMLU-Pro unlock tier-busting quality. At 80–96 GB, Llama 4 Scout 109B Q4 or Mistral Large 2 123B Q4 dominate. At 128 GB+, DeepSeek-V3-0324 Q8 at 84.7 MMLU-Pro or FP16 70B-class models are viable. License filtering is critical. Apache 2.0 and MIT permit unrestricted commercial use without revenue caps. Llama and Gemma terms impose 700M+ user caps and derivative model restrictions. These disqualify enterprise deployments. Four of the 12 top-ranked models carry these limitations. The table is only useful if you read both columns, score and license, before downloading.
Hardware Tiers: What Each Budget Actually Runs
The three CraftRigs tiers map directly to effective model access through quantization ceilings. The $1,200 entry tier at 24 GB VRAM, used RTX 3090 or new RTX 5070 Ti, runs 70B Q4_K_M at 15–25 tok/s or 14B Q8_0 at 35–50 tok/s. The $2,000 mid tier at 48 GB via dual 24 GB or Apple M4 Max 64 GB unified unlocks 70B Q8_0 or 235B Q4_A22B at 20–30 tok/s. The $4,500+ high tier at 80–192 GB, RTX 5090 32 GB ×2–3 or Mac Studio M3 Ultra 192 GB, reaches 109B Q4 or FP16 70B at 25–40 tok/s. Each tier's ceiling is quantization, not parameter count. A $1,200 buyer cannot access 70B quality at FP16 regardless of model choice. The hardware determines the compression, which determines the effective model tier.
The hidden cost of "fitting" a model into available VRAM is context length collapse. A 70B Q4_K_M on 24 GB leaves less than 2 GB headroom for context, forcing 2K–4K context limits versus 32K+ on 48 GB. Buyers optimizing for long-document or multi-turn chat must budget for VRAM overhead. That's model weights plus KV cache plus working buffer. Typically 1.2–1.4× raw model size. This makes the $2,000 tier the practical minimum for production local use beyond single-turn inference. A developer running RAG over 50-page documents needs that overhead. A chatbot with 10-turn memory needs it. The entry tier works for stateless completion. Anything stateful requires headroom that 24 GB cannot provide. The tier decision is a context-length decision disguised as a budget decision.
Three Rules for Picking Your Local Model in 2026
Rule 1 is non-negotiable: match VRAM to quantization tier, not parameter count. Twenty-four GB hardware locks you to Q4_K_M with a 70B maximum. Forty-eight GB unlocks Q8_0 or 235B Q4. Eighty GB+ enables 109B-class Q4 or FP16 70B. Buying for "future proofing" without quantization headroom wastes budget. A 70B Q4 on 24 GB underperforms a 32B Q8 on identical hardware for reasoning tasks. GPQA Diamond hits 34% versus 41%. The parameter count obsession is a market failure. Vendors advertise model size; builders need to advertise VRAM tier and quantization level. Your effective model is defined by the intersection of hardware ceiling and compression tolerance. Not by the biggest number in the model card.
Rule 2 — Benchmark for Your Actual Task, Not the Leaderboard
Task-specific benchmark triage prevents leaderboard-driven mispurchases. Coding workloads prioritize HumanEval and MultiPL-E with a target ≥65%. Long-document work demands RULER 128K ≥75%. Chat and reasoning quality track GPQA Diamond ≥40%. Leaderboard ELO diverges up to 15% from task-specific scores. A "top 3" model can be third-best for your actual use case. The divergence is systematic. Chat optimization rewards fluency. Coding optimization rewards correctness. Reasoning optimization rewards structured inference. A model cannot be globally optimized for all three. Your benchmark target should be a single metric that matches your production workload. Not an aggregate that averages away your requirement.
Rule 3 — Check License Before You Download
License lock-in risk is invisible in benchmark tables but decisive in deployment. Apache 2.0 and MIT permit unrestricted commercial deployment. Llama 3.1 Community and Gemma Terms impose 700M+ user caps and derivative model restrictions. These block enterprise use. Four of the 12 top-ranked models carry these commercial limitations. The legal review should happen before the download, not after integration. A model that scores 82.1 MMLU-Pro is worthless if its license prohibits your use case. The benchmark table includes license type because this check is routinely skipped. Self-hosting for commercial use requires license verification as a gate, not an afterthought.