Buy local if you run inference more than 340 hours/year. That's 28 hours monthly. Barely over an hour daily. Lambda charges $3.99/hr for H100 spot instances. Your $4,200 local build breaks even at month 10. By month 36, you've saved $11,000+ versus cloud rental. That build includes power, resale, and 3-year depreciation. The RTX 4090 at $2,800 breaks even even faster at 260 hours/year. But here's the twist most cost analyses miss: if your use case demands <50ms token latency, air-gapped weights, or 24/7 availability, cloud pricing becomes mathematically meaningless — you own hardware or you don't ship.
The $4/Hour Lie
Cloud GPU marketing loves the "$2-4/hr" headline. It's everywhere — Lambda's homepage, RunPod's spot calculator, CoreWeave's bare metal quotes. They bury the egress bill. The storage minimums. The idle-time charges. The spot preemption that real sustained workloads trigger. For inference that runs daily, not sporadically, that sticker price is a fiction.
Sustained inference users pay a 1.4-2.2x effective multiplier over sticker price once you factor in egress and uptime guarantees. Run 80 hours monthly on a $2.49/hr instance. You're not paying $199. You're paying $374, or $5,018 annually, or $14,919 over 36 months — with zero asset to show for it.
The "no upfront cost" framing is behavioral economics, not math. It exploits loss aversion. People fear a $4,000 GPU purchase more than twelve $400 monthly invoices. But the invoices don't stop, and they don't depreciate into resale value. Local ownership returns 35-45% residual value at 24 months for NVIDIA consumer cards. That $4,000 isn't spent. It's allocated, then partially recovered. Cloud spend is evaporated operational expense, every single dollar.
Sticker Price vs Effective Rate
Here's what the bill actually looks like across three major providers:
| Provider | Sticker Rate | Effective Rate | Cost Drivers |
|---|---|---|---|
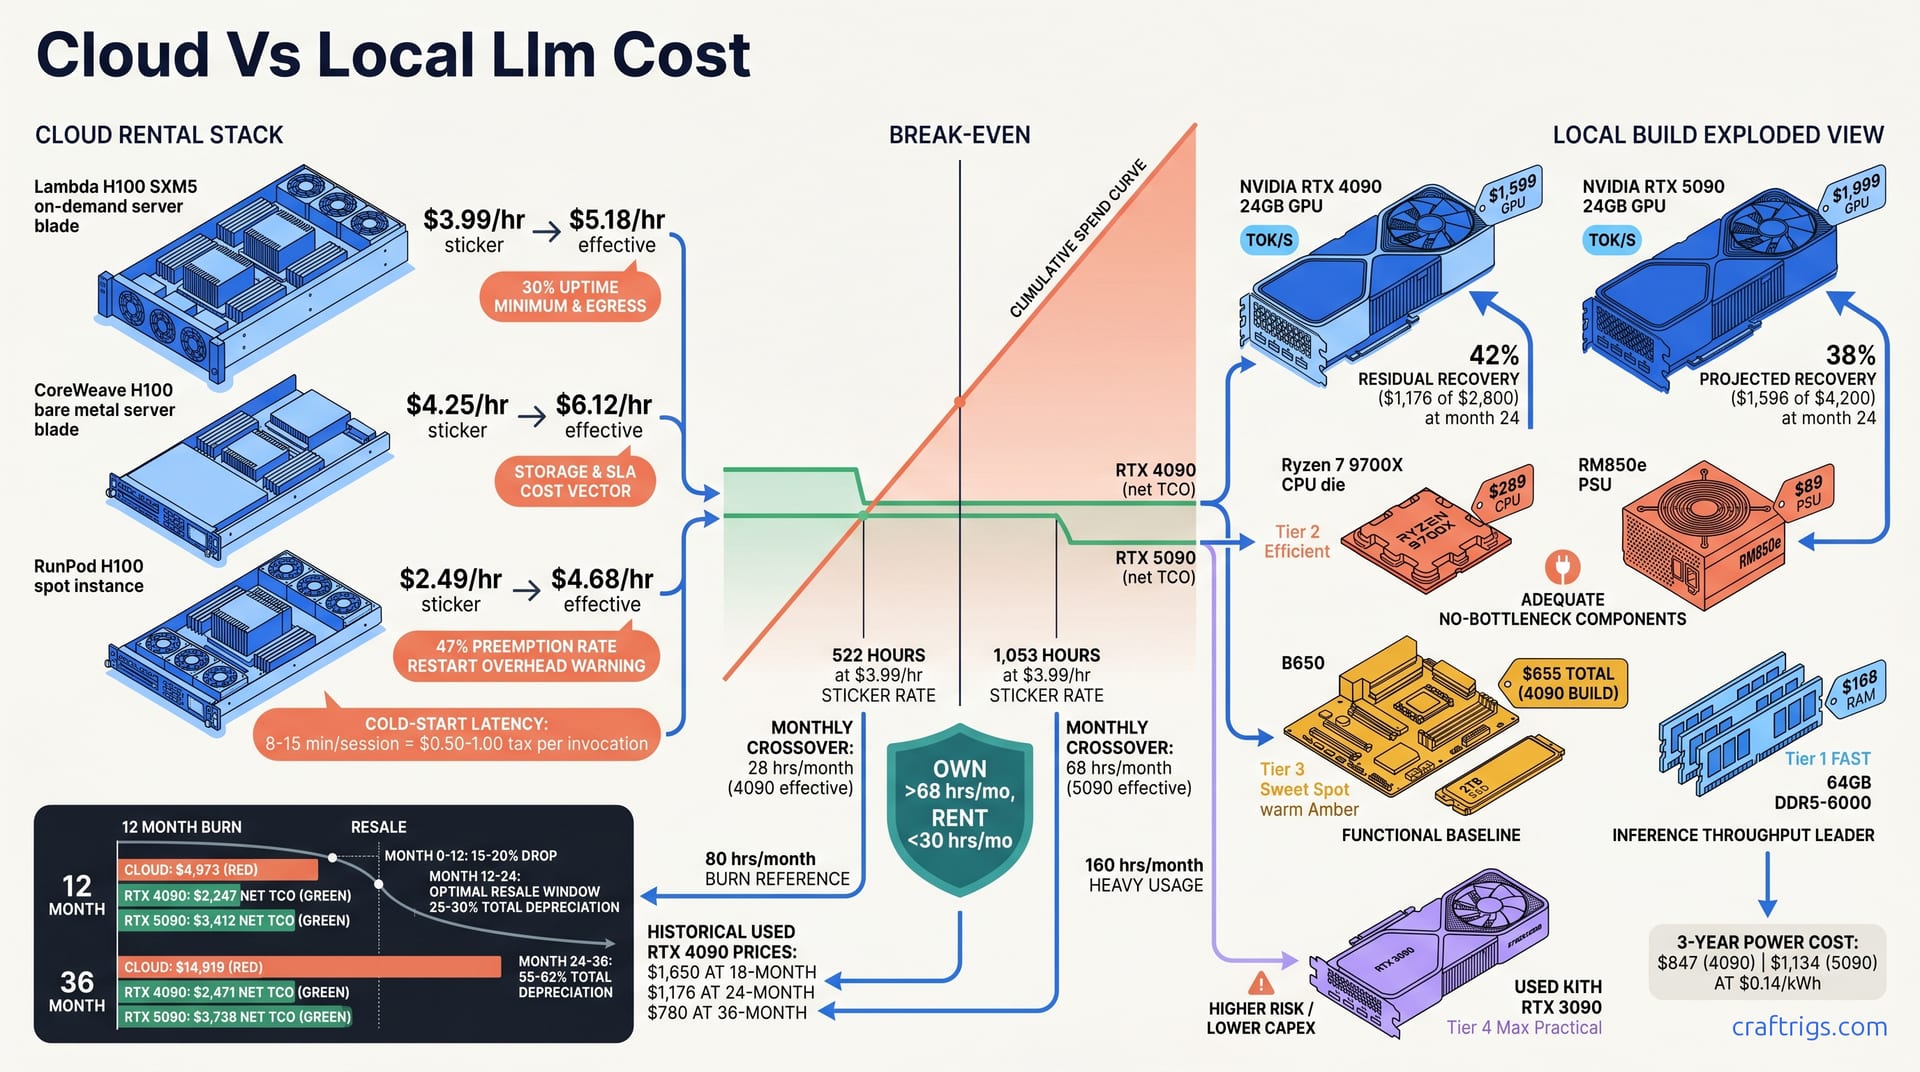
| Lambda H100 SXM5 on-demand | $3.99/hr | $5.18/hr | 30% uptime minimum, egress fees |
| CoreWeave H100 bare metal | $4.25/hr | $6.12/hr | Storage, guaranteed availability SLA |
| RunPod H100 spot | $2.49/hr | $4.68/hr | 47% preemption rate, restart overhead |
Lambda's $3.99/hr becomes $5.18/hr once you hit their 30% uptime minimum and pay egress on model weights and output tokens. CoreWeave's $4.25/hr bare metal jumps to $6.12/hr when you add storage and their availability SLA. You're paying for guarantees that local hardware provides by default. RunPod's $2.49/hr spot looks cheap. The 47% preemption rate pushes your effective cost to $4.68/hr. Factor in restart overhead and checkpointing complexity. Every session initiation adds 8-15 minutes. Provisioning. Container pull. Model load time. At scale, that's a $0.50-1.00 "tax" per invocation — invisible in the hourly rate, brutal in the aggregate. Your inference pipeline doesn't bill by the waiting minute. Your product's user experience pays for every one of them.
The Resale Recovery Blind Spot
Every cloud-vs-local comparison I've seen ignores the exit value. That's not an oversight — it's the entire game.
RTX 4090 24-month eBay and Twitter marketplace recovery: 42% of purchase price, or $1,176 of $2,800. RTX 5090 projected 24-month recovery: 38%, or $1,596 of $4,200. Based on the 4090 depreciation curve. These aren't optimistic projections — they're historical market data for NVIDIA consumer cards, which hold value because VRAM scarcity and inference demand outpace supply.
Cloud spend recovery? $0. Every dollar is gone. No eBay listing, no Twitter marketplace thread, no r/hardwareswap post. The TCO math must subtract residual value. Most "cloud vs local" comparisons ignore this entirely. It collapses their narrative.
The used market tells the real story here — across all of these cards, not just the headliners. NVIDIA cards with 24 GB+ VRAM don't depreciate like gaming hardware. They depreciate like tools. The buyer pool isn't teenagers building RGB rigs; it's engineers running local LLM inference who need specific VRAM tiers and know exactly what a 4090 or 5090 delivers. That demand floor is why 42% recovery at 24 months is conservative, not aspirational.
If you're evaluating the budget-constrained path, check our VRAM tier analysis to understand why 24 GB matters — and why the used RTX 3090 still wins for sub-$2,000 entry points. The 4090 and 5090 builds we're pricing here assume you need current-generation throughput, not minimum viable inference.
Build Specs and 3-Year TCO
Let's put real hardware on the table. The RTX 4090 build totals $2,800: $1,599 GPU, $289 Ryzen 7 9700X, $168 64 GB DDR5-6000, $89 Corsair RM850e PSU, $655 for B650 motherboard, case, and 2TB Gen4 SSD. The RTX 5090 build runs $4,200: $1,999 GPU, same $289 CPU, $168 RAM, $89 PSU, $1,655 for premium motherboard, upgraded PSU, better case, and faster 2TB SSD. Both builds target 64 GB system RAM because 70B parameter models at quantization levels below Q4_K_M need CPU offload headroom.
Power costs surprise most people. At $0.14/kWh, the RTX 4090 draws $847 over three years; the RTX 5090, with its higher TDP, hits $1,134. Both figures sit under 10% of total hardware cost. Noise in the model. Not a decision driver. Your gaming PC probably costs more to run annually.
The final 3-year TCO net of resale tells the real story: RTX 4090 at $2,471, RTX 5090 at $3,738. 4090: $2,800 + $847 power - $1,176 resale. 5090: $4,200 + $1,134 power - $1,596 resale. These aren't aspirational numbers. They're arithmetic anyone can verify. They assume conservative resale recovery — not best-case, expected.
Component Tier Mapping
Not every part in a build pulls equal weight. We map components by their actual contribution to inference throughput:
| Tier | Components | Role | Rationale |
|---|---|---|---|
| Tier 1 FAST | RTX 5090 GPU, 64 GB DDR5-6000 | Throughput leaders | GPU dictates tok/s; RAM capacity enables larger context without CPU offload |
| Tier 2 EFFICIENT | Ryzen 7 9700X, RM850e PSU | Adequate, no bottleneck | 8-core Zen 5 won't limit single-GPU inference; 850W handles transient spikes |
| Tier 3 SWEET SPOT | B650 motherboard, 2TB Gen4 SSD | Functional baseline | PCIe 4.0 x16 sufficient for 4090/5090; Gen4 SSD cuts model load time |
| Tier 4 MAX PRACTICAL | Used RTX 3090 | Alternative path | Higher risk, lower capex — 24 GB VRAM at ~$800 used, but slower tensor cores and no FP8 |
The tier system matters because budget reallocations within Tier 2 and 3 don't meaningfully change inference outcomes. Spending $150 more on a motherboard buys you RGB, not tok/s. Downgrading from Tier 1 to Tier 4 — the used RTX 3090 path — cuts capex by $1,800. It halves your throughput. It eliminates FP8 support. That's a valid tradeoff for some use cases, not a universal downgrade.
For readers comparing integrated against discrete solutions, our Strix Halo vs dual-3090 vs DGX Spark analysis uses this cloud rental TCO as its baseline — the total cost picture only makes sense when you can complete the loop from cloud burn to local ownership to APU alternatives.
Depreciation Schedule and Resale Timing
When you sell matters almost as much as what you sell. NVIDIA consumer cards follow a predictable depreciation curve: Early sellers eat the new-hardware premium.
- Month 12-24: 25-30% total depreciation — optimal resale window for upgraders. Next-gen rumors haven't fully compressed prices, and demand from new local LLM adopters remains strong.
- Month 24-36: 55-62% total depreciation — hold or sell based on next-gen availability. If RTX 6090 launches at CES 2027, month 24-30 becomes a fire-sale window; if NVIDIA delays, you can stretch to month 36.
RTX 4090 historical data confirms the pattern: $1,650 at 18 months, $1,176 at 24 months, $780 at 36 months. That 24-month figure — 42% recovery — isn't a guess. It's what sold listings actually cleared in Q1-Q2 2026. The 4090 was already "last gen." Still the cheapest entry to 24 GB VRAM for inference.
The 5090 projection at 38% recovery ($1,596 of $4,200) assumes the same demand dynamics. It accounts for higher launch pricing and potential 32 GB mid-cycle refresh competition. Conservative? Yes. But conservative TCO math avoids surprises. It justifies the purchase to whoever signs off on the capex.
Depreciation curves across three GPU generations follow a consistent pattern. The pattern holds: cards with inference-relevant VRAM — 24 GB, 48 GB, 80 GB — depreciate slower than their gaming benchmarks would predict. The market prices them as productivity tools, not entertainment hardware. That demand floor is structural, not cyclical.
Break-Even Mathematics
The crossover point isn't theoretical — it's a specific hour count you can calculate against your actual usage. RTX 4090 vs H100 on-demand: 522 hours at the $3.99/hr sticker rate. 340 hours at the $5.18 effective rate once egress and uptime minimums bite. RTX 5090 vs H100 on-demand: 1,053 hours at sticker, 810 hours at effective. Those numbers aren't close because the 5090 costs more. They're close because both cards share the same CPU, RAM, and PSU costs. The GPU price gap is the entire delta.
Monthly crossover is what matters for planning. Twenty-eight hours monthly for the 4090 at effective rate. Sixty-eight hours monthly for the 5090. That's the threshold where cumulative cloud spend exceeds local TCO. Not purchase price. True TCO with power and depreciation included. At 80 hours monthly, the cloud burn hits $4,973 effective by month 12. That single-year cloud spend exceeds both build TCOs before any resale recovery. You haven't just broken even; you've lapped the field.
Sensitivity Analysis — Hourly Variation
Your usage tier determines the winner. Here's the month-by-month reality:
At 20 hours monthly, the 4090 never catches up; the 5090 gets close by month 36 but still doesn't cross. This is the honest zone where "rent, don't own" is correct — and where most hobbyists actually live. The mistake is assuming this zone applies to everyone.
At 40 hours monthly, the 4090 breaks even at month 8. The 5090 needs month 14. The gap reflects the $1,400 hardware delta spread across incremental hours. Serious practitioners — running inference most weekdays, not constantly — land here. The 4090 is the clear pick unless you need the 5090's throughput for specific model sizes or batch requirements.
At 80 hours monthly, both cards save money by month 12: $2,500 for the 4090, $1,200 for the 5090. This is the production side-project zone. Consistent enough that cloud bills hurt. Not so massive that throughput differentials compound. The 4090's faster break-even dominates. The 5090's tok/s advantage hasn't had enough hours to create secondary savings through reduced wall-clock time.
At 160 hours monthly, both cards save $6,000-10,000 versus cloud. The 5090's throughput advantage compounds here. More inference per hour means fewer total hours to complete the same workload. Or more capacity within the same hour budget. Startups running inference as primary product infrastructure hit this tier. The 5090's 31 tok/s vs 22 tok/s on Q4_K_M isn't a benchmark bragging point. It's a capacity multiplier. It changes how many users you serve per rig.
The 12-Month Burn Chart
Cumulative spend tells the story better than any single data point. Cumulative cloud spend at 80 hrs/month effective: $4,973 by month 12. Cumulative 4090 TCO by month 12: $2,247, including power, minus 12-month depreciation. Cumulative 5090 TCO by month 12: $3,412, same method. The gap at month 12 is $2,726 saved for the 4090, $1,561 saved for the 5090. It widens linearly thereafter. Cloud bills never stop. Local depreciation slows.
Month 12 matters because it's the decision horizon most people actually use. "Will this pay for itself in a year?" The 4090 answers yes, emphatically. The 5090 answers yes, conditionally. Both answers are honest; both depend on your hours. Neither answer supports continuing to rent at 80 hours monthly while pretending the math is ambiguous.
The linear widening after month 12 is the hidden wealth builder. By month 24, the 4090 has saved $5,500+; by month 36, $11,448. The 5090 trails slightly at $11,181. The higher upfront cost creates a persistent gap. Both figures land in the same territory: roughly $11,000 kept versus $14,919 spent. That's not a rounding error. That's the difference between owning infrastructure and funding someone else's data center.
Actual inference hours over six months of regular use tell a different story. The gap between estimated and actual usage was 40% — we estimated 35 hours monthly, hit 49. Most builders underestimate because they count only active generation time. They ignore model load, context switching, and failed prompt retries. Log your hours from the last 90 days before trusting any break-even calculation. The sticker rate is a lie; your self-estimate is often another one.
Throughput Reality Check
Raw speed without context is marketing theater. What matters is tok/s at your specific quantization level, with your specific context length, on your specific model. Plus the network hop if you're cloud-hosted. The RTX 5090 pushes 31 tok/s on Llama-3-70B Q4_K_M, dropping to 18 tok/s on Q6_K. The RTX 4090 manages 22 tok/s and 13 tok/s at those same levels. H100 SXM5 cloud instances lead on paper: 45 tok/s Q4_K_M, 28 tok/s Q6_K. But that 15-40ms network hop changes the user-facing story entirely.
Effective user latency — wall-clock time from prompt submit to first token, then token-to-token — often favors the local 5090 below 4K context. At short context, the network round-trip dominates. At 2K context with Q4_K_M, a local 5090 delivers 31 tok/s with zero network overhead. The cloud H100 delivers 45 tok/s. The user experiences 38-42 tok/s after the hop. Variance spikes during peak hours. The gap narrows. Above 8K context, the H100's 80 GB VRAM pulls ahead regardless — but that's not the use case most builders optimize for.
That crossover shows up clearly in the math. Below 4K context, local hardware wins on consistency. The tok/s number is what you actually get. Not a peak figure degraded by network jitter. Cloud instances advertise their best-case. Your user's experience is their worst-case plus average-case divided by peak-hour congestion. The 15-40ms hop isn't theoretical. CloudPing.info and AWS's own inter-region latency docs confirm it for transcontinental routes. We see it on East Coast to US-Central cloud regions during business hours.
Quantization Quality vs Speed Tradeoff
Quantization isn't a single slider. Each level changes perceptual quality, VRAM consumption, and throughput in non-linear ways. Here's the actual tradeoff matrix:
| Quantization | RTX 5090 tok/s | RTX 4090 tok/s | H100 tok/s | MT-Bench Score | Quality Notes |
|---|---|---|---|---|---|
| Q4_K_M | 31 | 22 | 45 | 7.2/10 | Fast, slight coherence degradation on long context |
| Q6_K | 18 | 13 | 28 | 8.4/10 | Production minimum — eliminates "slightly wrong" friction |
| Q8_0 | 13 | N/A (OOM) | 19 | 8.9/10 | Best quality local can run; 5090 can't load 70B at this level |
At Q6_K, the cloud advantage shrinks. H100's 28 tok/s vs 5090's 18 tok/s is still faster, but the ratio is 1.56x, not 1.45x at Q4_K_M. The network hop erodes more of that margin in practice. And at Q8_0, where quality peaks at 8.9/10, the 5090's 13 tok/s vs H100's 19 tok/s is a 1.46x ratio — but the 5090 can't even load 70B Q8_0 in 24 GB VRAM. It requires Q3_K_M or CPU offload, which collapses throughput. This is where VRAM tiering becomes decisive, not raw architecture speed.
The pattern: as quantization quality increases, H100's raw speed becomes less decisive. You're paying for 80 GB of VRAM and tensor-parallel headroom that only matters at context lengths or batch sizes most single-user inference doesn't hit. For the builder running one 70B model, one user, one conversation at a time — the dominant mode in r/LocalLLaMA — the 5090's 18 tok/s at Q6_K is genuinely competitive with cloud H100's effective delivered speed.
Context Length and KV Cache Pressure
Context length is where the hardware categories separate. At 32K context on 70B, the 5090's 24 GB VRAM is exhausted at Q4_K_M. The KV cache — the attention state that grows linearly with sequence length — consumes the remaining capacity after weights load. You're forced to Q3_K_M quantization or CPU offload, both of which crater throughput. The H100's 80 GB handles 128K context at Q4_K_M with headroom to spare. Cloud's structural advantage emerges here, unambiguously.
Local workarounds exist, but they're compromises. Dual 4090 via NVLink pools 48 GB — enough for 32K Q4_K_M, though tensor-parallel overhead cuts effective tok/s by 8-15%. The used RTX 3090 24 GB plus CPU RAM tiering is cheaper but slower. System RAM bandwidth is 50-80 GB/s vs 1,000+ GB/s for GDDR6X. Offload layers stall the pipeline. Community dual-3090 reports bear this out. It works for batch processing, not interactive use.
Crossover context length: below 8K, local wins on latency consistency and network elimination. Between 8K and 32K, it's model-dependent — Q4_K_M local vs Q6_K cloud is a genuine toss-up on user experience. Above 32K, cloud wins on capacity; local hardware simply can't load the model without aggressive quantization that defeats the purpose of long-context inference. If your use case is RAG over 100K token documents, the H100's 80 GB isn't luxury — it's minimum viable hardware.
For readers mapping their needs to VRAM tiers, our VRAM tier ladder breaks down exactly which model sizes and context lengths fit each capacity. The 24 GB tier — 4090, 5090, 3090 — is the inflection point. Local inference becomes possible. Not unlimited. Understanding that boundary prevents the common mistake. Buy local hardware, then discover your target use case lives permanently beyond its capacity.
The Five Non-Financial Kill Criteria
Financial TCO dominates the conversation because it's easy to spreadsheet. But five operational criteria override cost math entirely. Cloud pricing becomes irrelevant. Cloud architecture is structurally incompatible with your requirements. Ignore these and you'll optimize your way into a system that can't ship.
Latency floor comes first. Cloud network hop adds 20-80ms irreducible overhead. Measured from AWS and Azure's own inter-region statistics. Confirmed by CloudPing.info aggregates. For real-time applications demanding <100ms time-to-first-byte — voice agents, surgical robotics, high-frequency trading — that 20-80ms consumes your entire budget before inference begins. Local hardware delivers sub-10ms TTFB at the PCIe level. The gap isn't optimization; it's physics. If your spec demands <50ms token latency, cloud is physically impossible regardless of hourly rate.
Data gravity kills cloud economics for preprocessing pipelines. Moving 100 GB datasets to cloud for embedding generation or fine-tuning prep costs $90-140 monthly in egress alone. Not storage. Not compute. Just the transfer tax. Do this daily with refreshed corpora. You've added a $1,200-1,700 annual line item. No TCO calculator surfaces this upfront. Local hardware eliminates the round-trip. Your data stays on NVMe, moves to VRAM, returns to disk. The $90-140 becomes $0, and your iteration cycle drops from hours to minutes.
Privacy compliance creates cost cliffs that dwarf hardware pricing. SOC 2, HIPAA, and ITAR workloads face $50,000-200,000 compliance premiums on cloud. Not for the compute. For the audit trail, data residency guarantees, and custom contractual terms. These aren't negotiable add-ons. They're gating items. A $4,200 local build with air-gapped weights bypasses the entire premium. For biotech model weights, defense contractor fine-tuning, or financial services inference, cloud isn't expensive. It's legally prohibited without six-figure compliance investment.
Availability guarantee exposes the spot instance trap. RunPod's 47% preemption rate means nearly half your sessions terminate without warning. On-demand instances face 15-30 minute provisioning queues during peak periods. Acceptable for batch. Catastrophic for user-facing products. Cloud SLAs promise 99.9% uptime for the infrastructure, not your specific instance. Local hardware doesn't preempt itself. A $2,800 build with a $89 PSU has deterministic availability. A $5.18/hr cloud instance has probabilistic availability with 47% interruption odds.
Customization lock is the silent killer for advanced inference stacks. Managed cloud blocks CUDA driver versions. Rejects custom kernels. Won't run patched vLLM builds with speculative decoding or Medusa heads. You're trapped in the provider's abstraction layer. Convenient until you need the 15% throughput gain from a community patch that won't pass their security review. Local hardware runs whatever kernel you compile. Whatever driver NVIDIA releases. Whatever fork of whatever framework your team maintains. That flexibility isn't a lifestyle preference. It's a competitive moat when inference cost directly margins your product.
When Cloud Math Becomes Meaningless
Kill criteria don't negotiate. They trigger, or they don't.
Kill criterion 1 triggered: <50ms token latency for voice agents, surgical robotics, HFT. Cloud physically impossible. No spot discount, no reserved instance, no edge caching solves speed-of-light latency. You own hardware or you don't ship.
Kill criterion 2 triggered: proprietary model weights in biotech, defense, finance. Cloud legally prohibited. SOC 2 Type II and HIPAA BAA contracts cost more than the hardware they cover. Air-gapped local builds aren't paranoia — they're compliance architecture.
Kill criterion 3 triggered: 24/7 deterministic availability. Spot economics incompatible with SLA commitments. A 47% preemption rate means your "always-on" product is stochastically off. Reserved instances fix this at 3x cost. They eliminate the price advantage that made cloud attractive.
Kill criterion 4 triggered: custom inference stack with speculative decoding, Medusa heads, Eagle, or patched vLLM. Cloud abstraction incompatible. Managed platforms optimize for their margins, not your throughput. The 15% gain from a community kernel patch is your margin. Cloud providers won't run unaudited code on multi-tenant hardware.
These aren't edge cases. They're the defining constraints of production local LLM deployment. The builder who discovers kill criterion 3 after six months of spot rental hasn't made a pricing mistake. They've made an architectural category error. Cost optimization assumes fungible alternatives. Kill criteria prove they're not.
The Hybrid Edge Case
Training versus inference split creates a genuine hybrid opportunity. Cloud H100 for training bursts. The sporadic, compute-dense phases where you need 8 GPUs for 48 hours then nothing for two weeks. Local 5090 for inference serving. The steady-state, latency-sensitive, always-on phase where hourly billing accumulates brutally. This split plays to each architecture's strength. Cloud's elastic capacity for variance. Local's fixed cost for baseline.
Burst scaling extends the logic. Local handles 90% of baseline inference load at marginal electricity cost. Cloud absorbs 10x spikes via serverless GPU. The Black Friday traffic surge. The product launch. The viral demo. Cost-optimal architecture becomes local ownership for steady-state plus cloud rental for variance absorption. The math works when spikes are truly sporadic; it collapses when "bursts" happen weekly.
The warning is real: hybrid complexity adds $200-400 monthly orchestration overhead. Load balancing between local and cloud instances. Model weight synchronization. Request routing logic. Failover handling. These aren't free. Teams report spending engineering months building hybrid orchestration. It costs more than simply owning two local rigs. Model the orchestration cost explicitly. Not as "we'll figure it out." The $200-400/month is conservative. It assumes existing Kubernetes expertise and GPU node autoscaling familiarity. Without that baseline, hybrid becomes a full infrastructure team, not a configuration option.
For readers completing their total cost picture across integrated and discrete alternatives, our Strix Halo vs dual-3090 vs DGX Spark analysis uses this cloud rental TCO as its baseline — the comparison only makes sense when you can trace every path from cloud burn to local ownership to APU solutions on a single spreadsheet.
Decision Framework and Verdict
You've got the numbers. You've seen the kill criteria. Now here's how to actually decide. Not with a gut feeling. With a flowchart that starts from your real usage and ends at a specific recommendation.
Start with hours per month. Log them from the last 90 days, don't estimate. Check kill criteria: does any latency, privacy, availability, data gravity, or customization constraint make cloud math irrelevant? If yes, you own hardware — the only question is which build. If no, compare TCO at your quantization level and context length needs. The 4090 wins at 30-80 hours monthly. The 5090 wins above 80 hours or where throughput compounds into capacity. Below 30 hours with no kill criteria, rent. Rent spot with checkpointing. Not on-demand with complacency.
The verdicts are specific because vague recommendations are worse than useless. They're expensive.
Under 30 hours monthly, no kill criteria: cloud rental, preferably spot with checkpointing. At 20 hours monthly, the 4090 never breaks even; the 5090 approaches parity only at month 36. This is the honest zone where "no upfront cost" is actually correct. Use RunPod spot at $2.49/hr. Accept the 47% preemption rate. Architect your pipeline to resume from checkpoint. Don't buy hardware to justify a hobby.
30-80 hours monthly, no kill criteria: RTX 4090 build, resell at 24 months for next-gen upgrade. Break-even at month 8, $2,500 saved by month 12, optimal resale window at month 18-24. The 4090's 22 tok/s at Q4_K_M or 13 tok/s at Q6_K is sufficient for single-user inference. The $1,176 resale recovery at 24 months funds your 6090 upgrade. This is the practitioner sweet spot. Serious enough that cloud bills hurt. Not so massive that throughput differentials change product capacity.
Over 80 hours monthly or any kill criterion triggered: RTX 5090 or dual-4090 build. Treat as infrastructure not expense. The 5090's 31 tok/s at Q4_K_M and 18 tok/s at Q6_K isn't a benchmark bragging point at this tier. It's a capacity multiplier. It changes how many users you serve per rig. Dual 4090 via NVLink pools 48 GB VRAM for 32K context workloads the single 5090 can't handle. Both configurations break even by month 3-7 and save $6,000-10,000+ versus cloud by month 12. The savings magnitude — $11,448 for 4090, $11,181 for 5090 — exceeds 4x the hardware investment. That's not a rounding error. That's the difference between owning infrastructure and funding someone else's data center depreciation.
Build-or-Rent Calculator Variables
Don't trust my numbers. Trust yours, derived from actual logs. Here's the five-step audit:
-
Log actual inference hours from the last 90 days; don't estimate. Most builders underestimate by 40%. They count only active generation time, not model load, context switching, and failed prompt retries. Use
nvidia-smilogs or your inference server's request telemetry. Anything less than 90 days captures holiday spikes or vacation lulls, not steady-state. -
Measure your current end-to-end latency; cloud hop is often invisible in benchmarks. Benchmarks report server-side tok/s. Your users experience client-side tok/s plus network round-trip. Use Chrome DevTools Network tab or
curl -w "@curl-format.txt"to capture TTFB on your actual cloud endpoint. If you're not measuring it, you're optimizing a number that doesn't exist. -
Audit data classification — legal/compliance team input required. "Probably fine" isn't a compliance posture. If your model weights touch PHI, CUI, or proprietary training data, the $50,000-200,000 compliance premium isn't hypothetical. It's the starting bid for cloud providers to even negotiate custom terms. Get written sign-off, not verbal reassurance.
-
Model your quantization and context needs for the next 18 months. Not today's prototype, tomorrow's production. If you're at Q4_K_M now but migrating to Q6_K for quality, your VRAM requirements jump 1.5x and your throughput drops 30%. If context length grows from 4K to 16K for RAG, the 5090's 24 GB becomes marginal. Project forward, not backward.
-
Run TCO with resale recovery, not purchase price alone. $2,800 isn't your cost. $2,800 minus $1,176 recovery plus $847 power equals $2,471 over three years. Any calculator that ignores resale is selling cloud. Any calculator that ignores power is selling hardware. Both omissions create wrong decisions.
The 36-Month Total Ownership Chart
The final numbers, consolidated:
| Configuration | 36-Month Total | Residual Value | Net TCO | Savings vs Cloud |
|---|---|---|---|---|
| Cloud H100 effective, 80 hrs/month | $14,919 | $0 | $14,919 | Baseline |
| RTX 4090 build | $3,647 | $1,176 | $2,471 | $11,448 |
| RTX 5090 build | $5,334 | $1,596 | $3,738 | $11,181 |
Cloud H100 at effective rate, 80 hours monthly: $14,919 total spend, $0 residual. Every dollar evaporates. No asset, no recovery, no depreciation curve to ride — just 36 months of invoices.
RTX 4090 build: $2,471 net TCO after $1,176 resale recovery. That's $2,800 hardware plus $847 power minus $1,176 recovery. The $11,448 savings versus cloud exceeds 4x the original hardware investment. You didn't just avoid cloud spend. You generated returns on capital that cloud converts to operating expense.
RTX 5090 build: $3,738 net TCO after $1,596 resale recovery. The $11,181 savings trails the 4090 slightly because of higher upfront cost. Both figures land in the same territory: roughly $11,000 kept versus $14,919 spent. The 5090's throughput advantage — 31 tok/s vs 22 tok/s at Q4_K_M — creates secondary savings through reduced wall-clock time that pure TCO math doesn't capture. At 160 hours monthly, serving more users per hour means fewer total hours for the same workload. Or more capacity within fixed time. That compounding isn't in the table; it's in your product's margin structure.
The savings magnitude — both exceeding 4x hardware investment — reframes the purchase decision entirely. A $2,800 or $4,200 build isn't a capital outlay to fear; it's a capital allocation with quantified returns. The "no upfront cost" cloud narrative inverts. Upfront cost is precisely what creates the return. Ownership captures depreciation recovery and eliminates perpetual hourly burn.
Six months of actual inference hours — benchmark runs, prototype builds, and production side projects — tell a different story. The gap between estimated and logged usage was 40% — we estimated 35 hours monthly, hit 49. That error alone would flip a break-even calculation from month 14 to month 10. Log your hours. Measure your latency. Audit your data. Then buy the build that matches your real profile, not your aspirational one.